Every day, lenders using Valocity’s Valuation Ordering platform capture myriads of data about their lending portfolio. However, with so much data, it becomes challenging to have visibility over what is being recorded – or more importantly, what can be derived from it. Valocity Analytics Hub leverages real-time data that is captured in platform and throughout the valuation ordering process, to provide a central hub for insights on usage, market movement, concentration risk, and valuer performance. This empowers lenders to make data-driven decisions, monitor performance, and mitigate risks effectively.
Some of the available modules and solutions include:
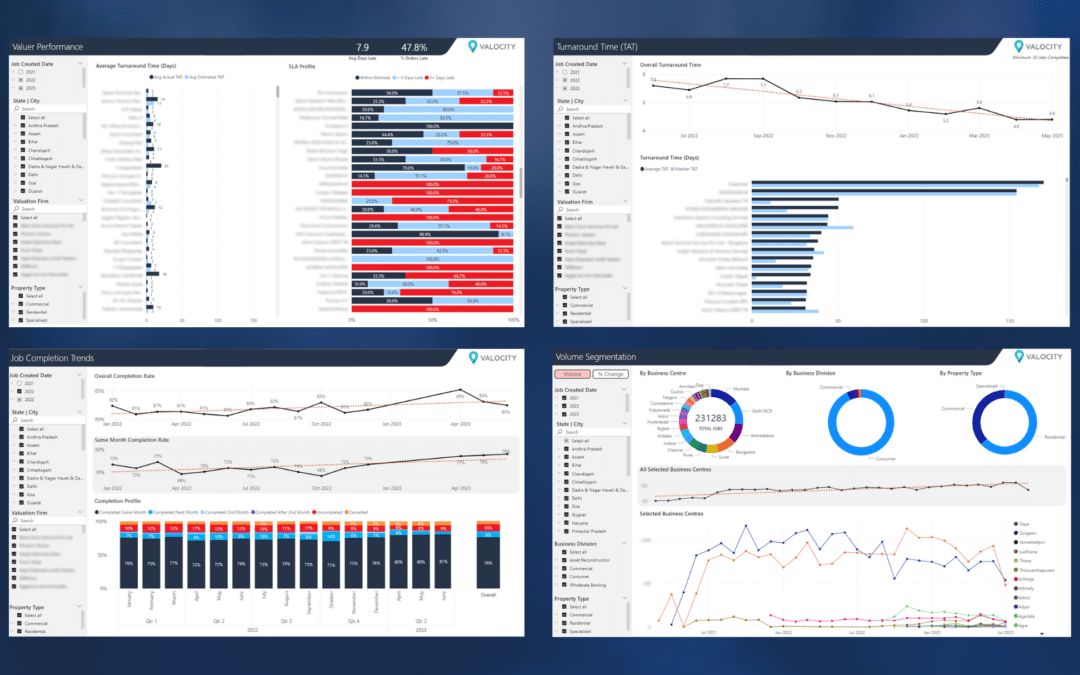
Valuer Performance Reporting Module
The Valuer Performance Reporting Module delivers real-time insights to transform the traditional approach to assessing valuer performance. Lenders can effortlessly track average Turnaround Time (TAT) and order completion rates within TAT, compare valuers’ performance, identify top performers, eradicate bottlenecks, and optimise resource allocation. The Valuer Performance Scorecard is automated in accordance with the requirements of each lender as well as statutory body requirements. By leveraging this solution, one of Valocity’s lender clients was able to reduce their average TAT by 20% in Q1 FY24.
")
Some information has been redacted to maintain confidentiality.
TAT Analysis (Turnaround Time Analysis)
Valocity’s analytics hub provides comprehensive month-on-month TAT analysis, enabling lenders to easily track valuation panel performance, performance trends and identify areas for improvement. Average and median TATs can be compared at state level, city level, and valuer level, empowering lenders to recognise top performers and address training needs. While leveraging Valocity’s real-time analytics, a client discovered that their Western India operation had consistently experienced longer TAT. The root of the issue stemmed from limited coverage area of their valuation panel, and it was with this information that the lender expanded their panel of valuers to successfully eliminate the problem.
")
Some information has been redacted to maintain confidentiality.
Job Completion Trends
With Valocity’s Job Completion analysis, lenders gain real-time visibility into critical performance metrics that shape the success of lending operations. For example, users can track how many valuations are being completed within the same month they were initiated, and how many are spilling over to optimise workflow. A Valocity lender reduced their spillover cases by 28% in Q1 FY24, helping them significantly increase business efficiency.
")
Some information has been redacted to maintain confidentiality.
Business Volume Segmentation
Volume segmentation enables lenders to break down the copious amounts of login data into smaller, more manageable segments. This segmentation allows for granular analysis, empowering lenders to monitor risk composition of the underlying portfolio. By conducting volume segmentation at a business division level, the user gains a real-time understanding of business composition and can formulate policies that mitigate over-dependence on a specific division. One of Valocity’s lender users transitioned from a reactive to a proactive approach by incorporating this change into their workflow. Previously, the client received monthly data requiring lengthy analysis and heavy reliance on quarterly trends. They can now analyse Valocity’s real-time data as required and take corrective actions at a pace.
")
Some information has been redacted to maintain confidentiality.
Unlock the growth potential of your business with Valocity’s Analytics Hub.
Book in your demo today or email us to find out more.