
Brought to you by Senior Research Analyst Wayne Shum
National Valocity Value Index eased 0.2%, but the South Island kept growing
New Zealand property values eased again in October. The Valocity Value Index slipped 0.2% over the month to $950,000, taking the quarterly fall to 0.7%. Values are now 1.8% lower than six months ago and 0.9% below this time last year. That leaves the national index around 13.5% under its February 2022 peak of $1,098,000.
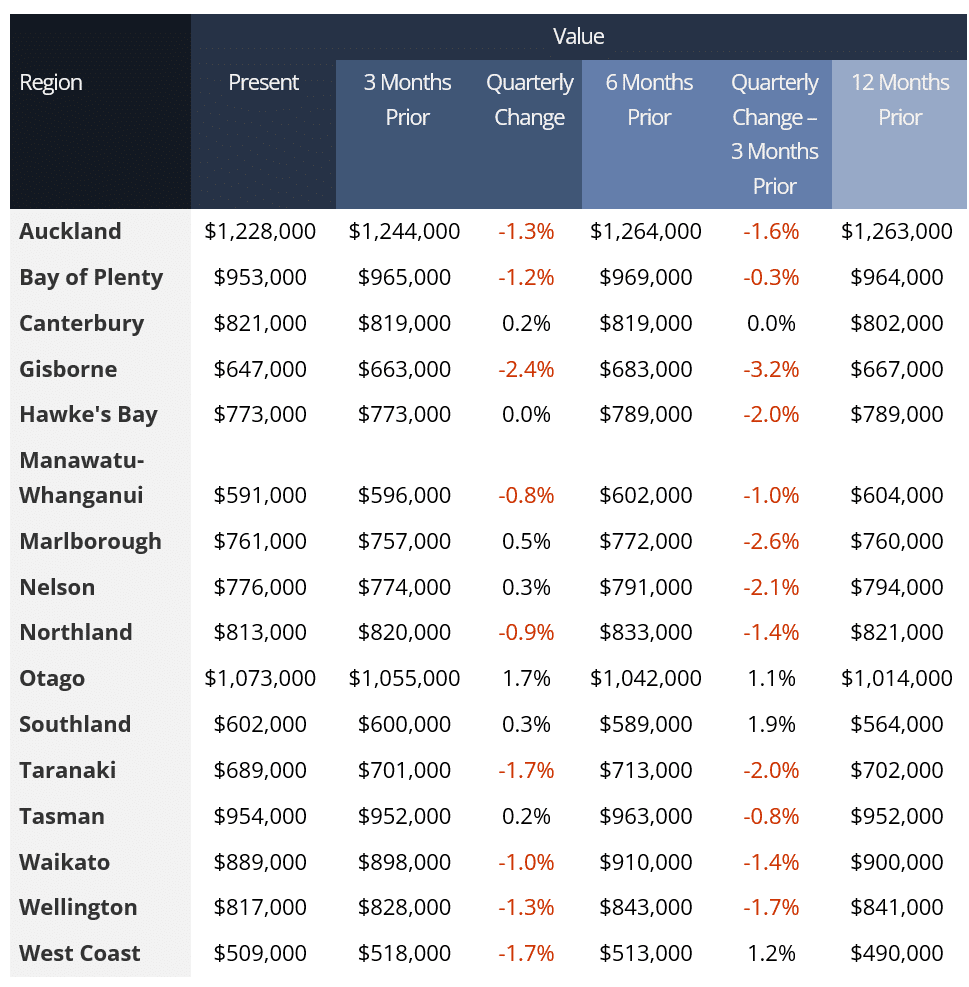
The North and South Islands continue to head in different directions. The Valocity Value Index recorded quarterly declines in nine of 16 regions, led by Gisborne (-2.4%), Taranaki (-1.7%) and West Coast (-1.7%), while Auckland fell 1.3% to $1,228,000 and now sits 22% below its January 2022 peak. In contrast, Otago, Southland, Canterbury, Marlborough, Nelson and Tasman all posted modest gains. Southland recorded the strongest annual growth in the country, up 6.7%.
Several factors are weighing on the market. Inflation remained above the 1%–3% target band, at 3.7% in Q3 2026, and the RBNZ held the OCR at 2.75% at the end of October, against most market forecasts. There is one more OCR review in 2026, on 9 December, before the Monetary Policy Committee returns in February 2027.
Annual net migration rose to a net gain of 20,500 in the year ended August 2026, the highest since December 2024, although this remains low compared to pre-COVID levels. In Australia, the unemployment rate reached 4.7% in September, its highest level in almost five years. This may slow the shift of New Zealand residents moving to Australia. New Zealand’s unemployment rate sits at an 11-year high of 5.6%.
Building consent volume continued to rise on an annualised basis, which may point to some confidence in a future market recovery. However, not all consented projects proceed to completed homes.
With the General Election on 7 November this year, some potential buyers are remaining on the sidelines, preferring to wait for greater certainty on the policy outlook before making decisions. Market activity typically slows in the lead-up to a General Election, as buyers and sellers wait to see how housing policy, lending and housing supply may change. Activity often picks up once the result is known. However, any lift is likely to be modest while unemployment remains elevated and borrowing capacity stays constrained.
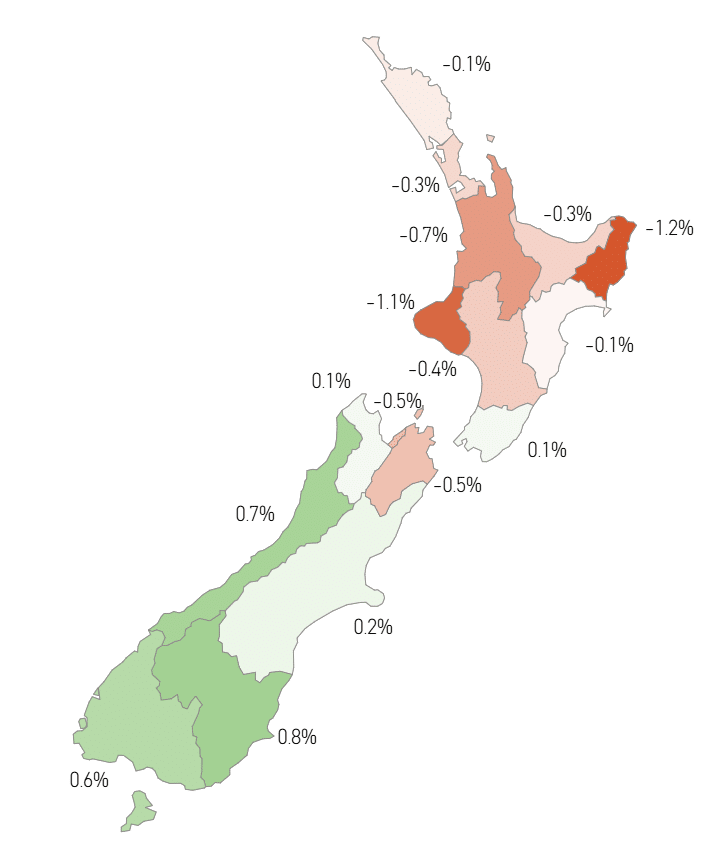
Figure 1: Valocity Value Index Monthly Movement by Region
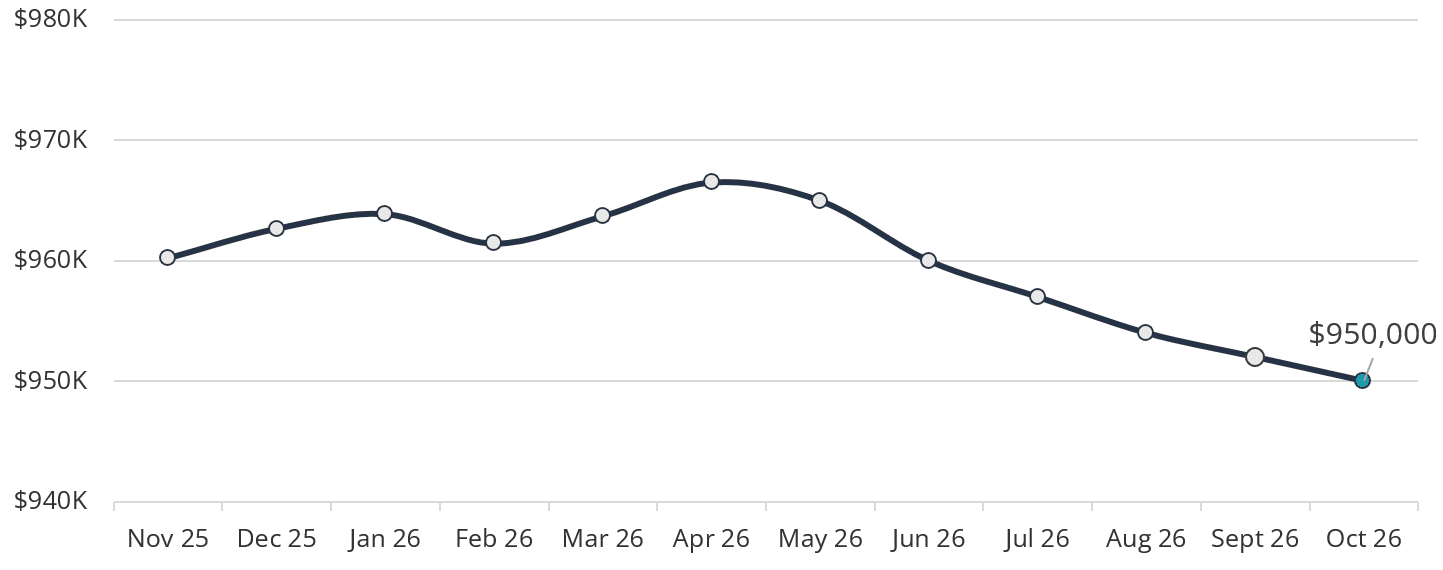
Figure 2: Valocity Value Index – New Zealand – Past 12 Months
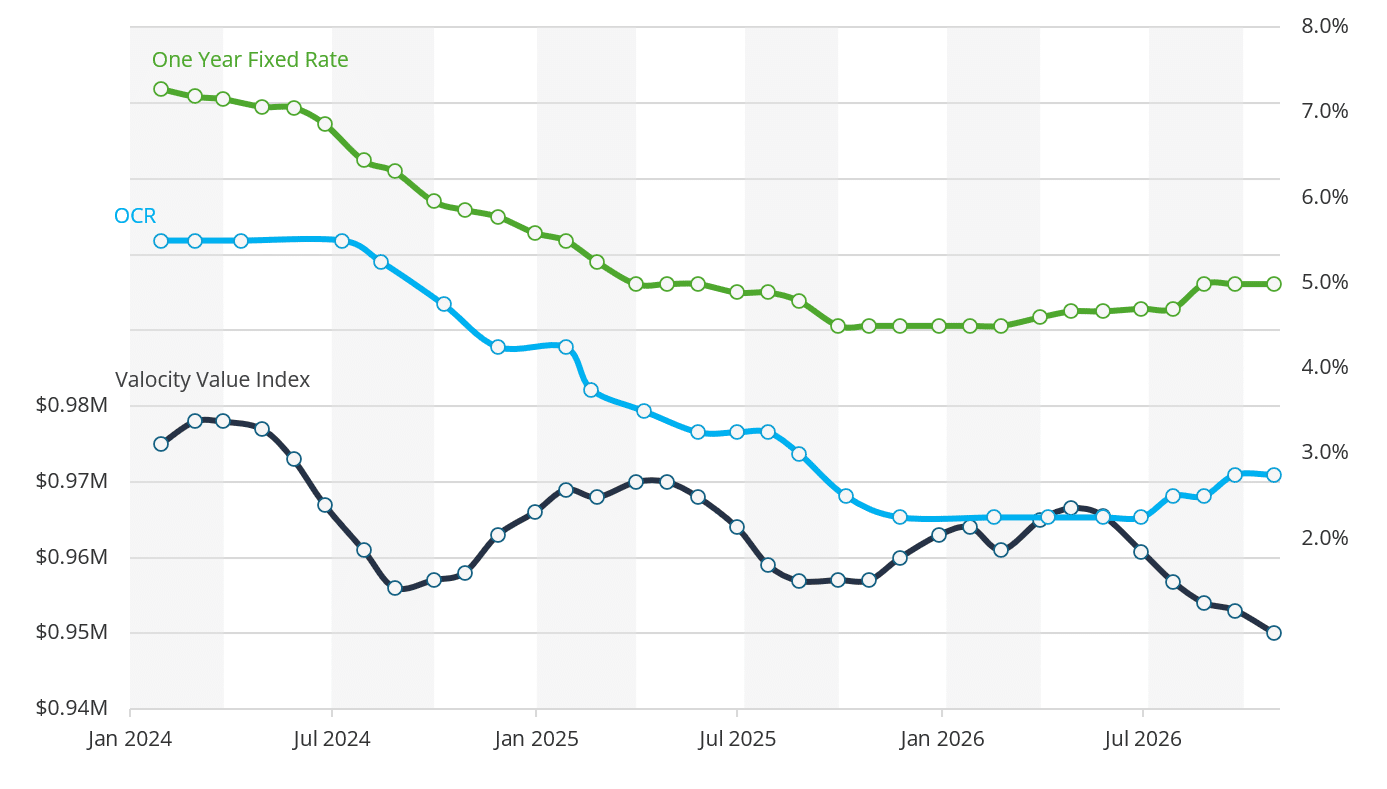
Figure 3: Valocity Value Index and Benchmark Rates
Value movement in 2026 has continued the pattern seen in 2024 and 2025, with changes remaining minimal. The Valocity Value Index is down 1.4% year-to-date.
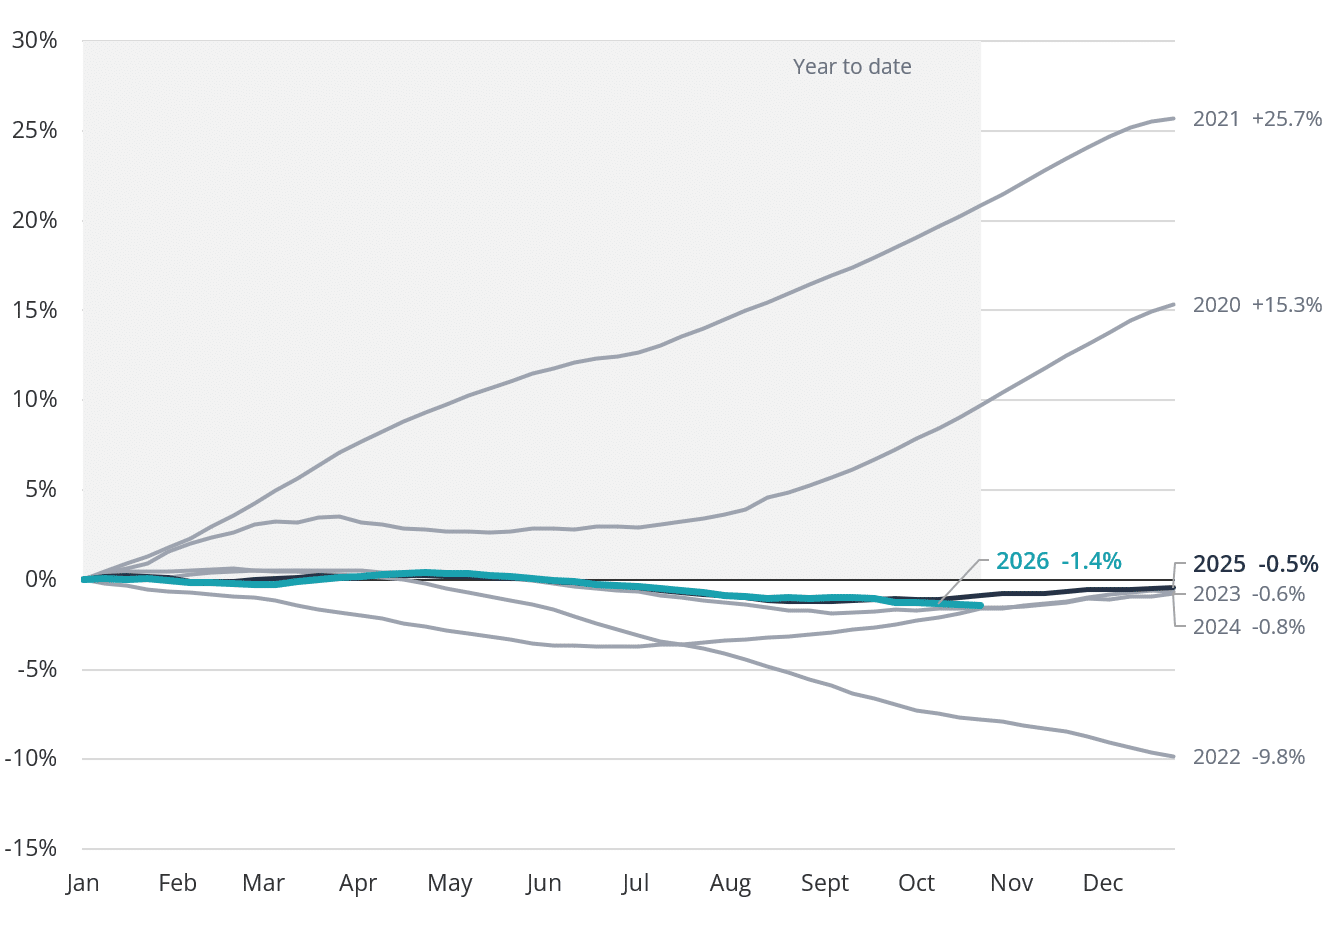
Figure 4: Valocity Value Index Movement – Year-on-Year Comparison
The national median sale price fell to $750,000 in Q3 2026. Higher mortgage rates have reduced borrowing capacity, while a higher cost of living is squeezing household budgets and debt-service capacity. Many would-be movers are also staying put, as some were unable to sell their current home at a price that allows them to trade up.
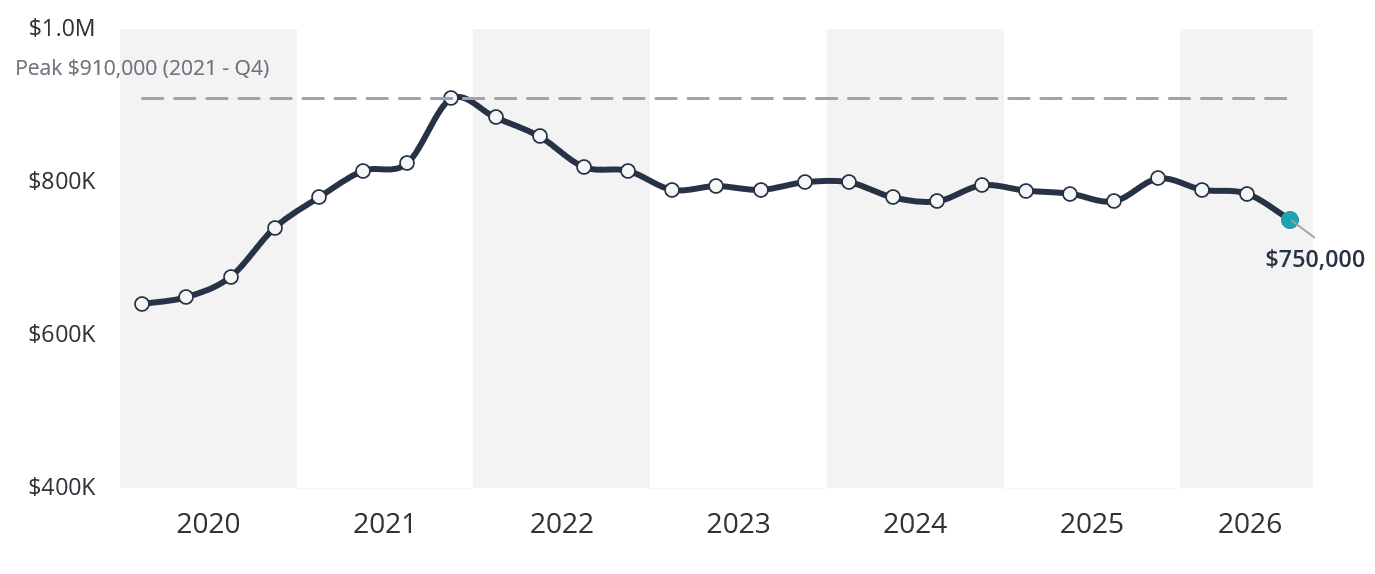
Figure 5: Median Sales Price (Settled Sales Only)
Net migration shows tentative signs of recovery, reaching 20,500 for the year ended August 2026. The improvement reflects a 3% fall in departures and a 6% rise in arrivals.
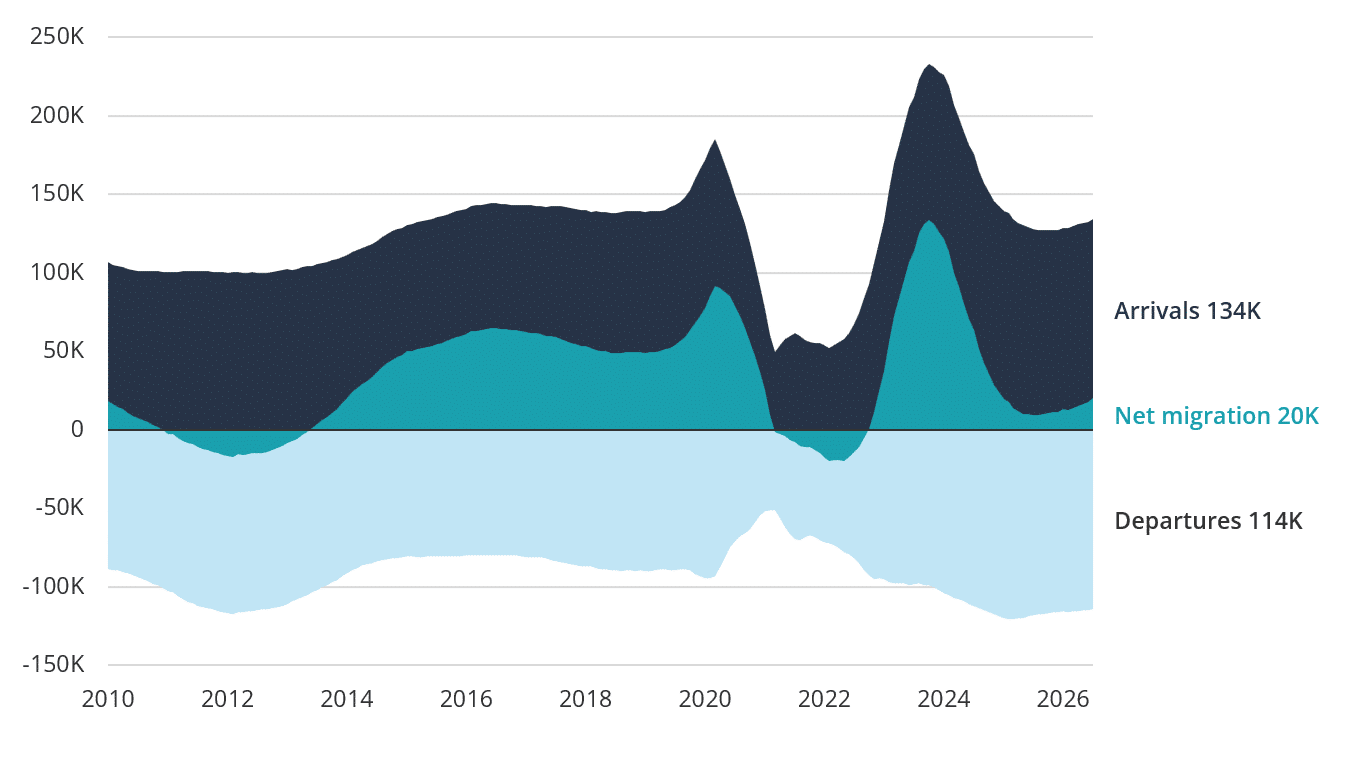
Figure 6: Annualised Net Migration (Statistics NZ)
Construction pipeline
New dwelling consents reached 40,581 in the 12 months to August 2026, up 21% on the prior year and a clear signal of recovering supply. It was the third consecutive month in which annualised consent volume exceeded 40,000.
Freestanding and multi-unit home consents both rose 21%.
Auckland consented 17,264 new homes in the past year, up 19% from August 2025.
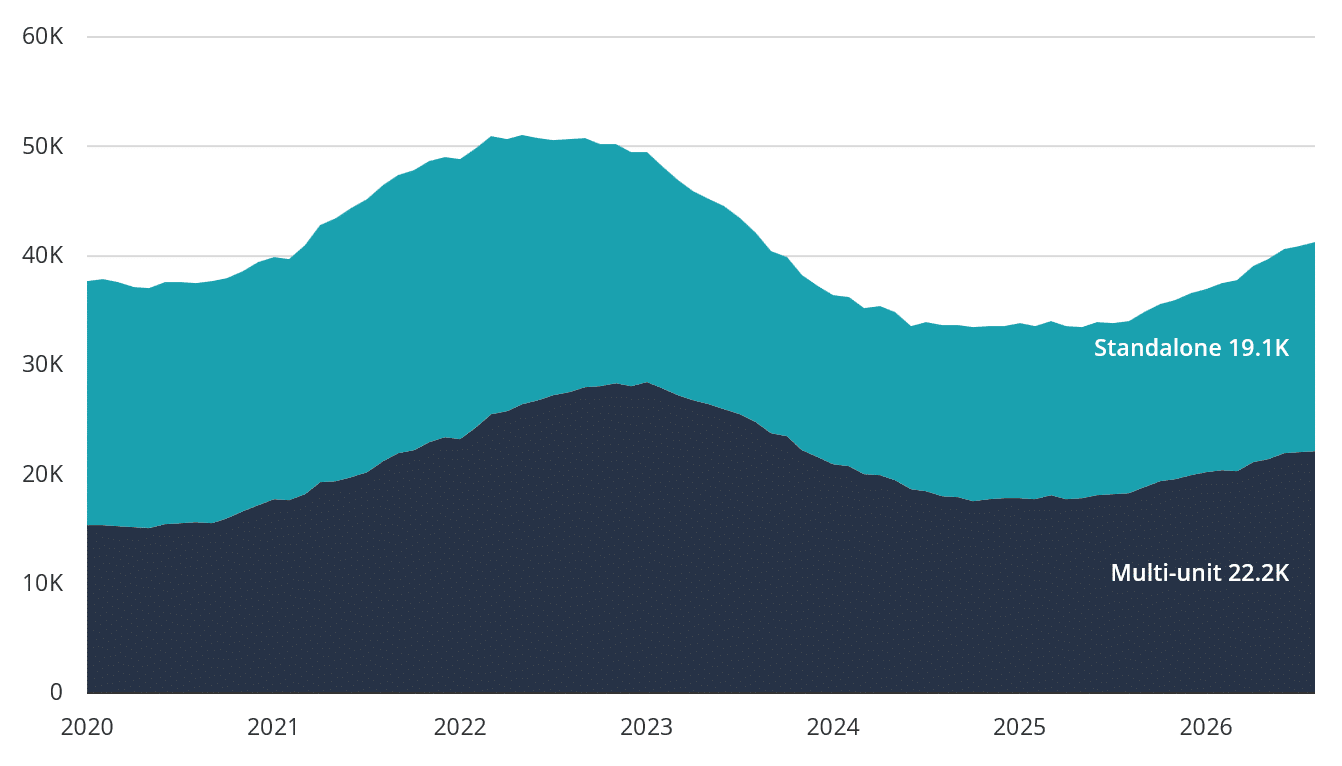
Figure 7: Composition of New Homes Consented – Annualised (Statistics NZ)
Valocity values
On the horizon
- General Election – 7 November 2026
- Financial Stability Report – RBNZ – 17 November 2026
- Monetary Policy Statement and OCR – RBNZ – 9 December 2026
For further information, or if you would like to understand more about New Zealand housing market insights, please contact [email protected].