

Brought to you by Senior Research Analyst Wayne Shum
Otago leads as the South Island sets new records
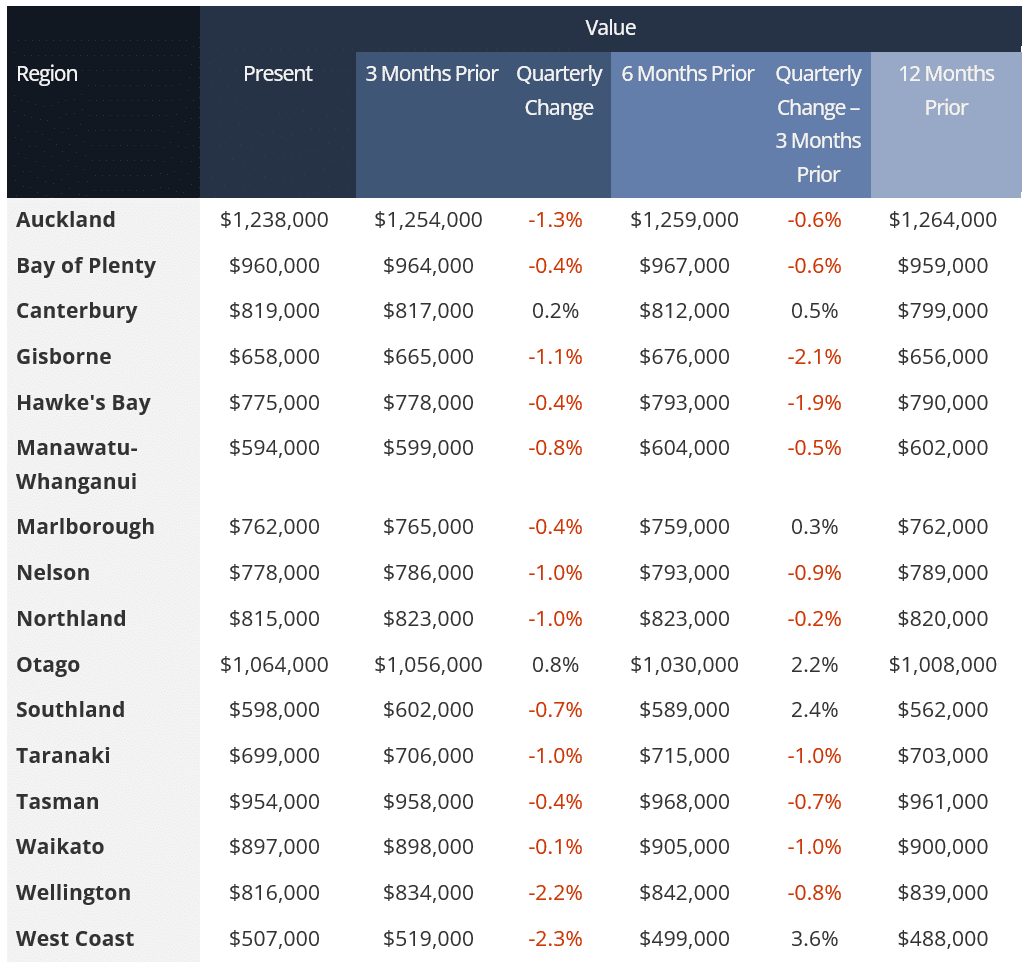
The national Valocity Value Index has held steady through 2026, sitting at $954,000 compared with $961,000 three months ago and $964,000 in January. Beneath that flat headline, individual markets are telling a very different story, with the lower South Island out in front.
Otago is the standout, reaching a record high of $1,064,000 at the end of September. Other South Island regions have also performed strongly over the past year, with Waimakariri, Central Otago, Queenstown-Lakes, and Gore all reaching record highs. Stratford in Taranaki joins them. A strong rural economy is underpinning growth across these locations.
It’s a different picture in the Auckland and Wellington regions, where weak employment markets have pulled values back to levels last seen at the end of 2020. Together, these markets account for approximately 40% of the country’s properties, so their weakness weighs heavily on the national result.
Elsewhere, several pressures are holding back price growth and activity. Listing volumes remain high, and with the traditional spring surge of listings expected, buyers have little reason to act quickly. Mortgage rates are rising and the cost of living keeps climbing, with fuel prices lifting again at the end of September. Net migration is recovering but remains low, and the employment market is still weak despite stronger job listings. For most market participants, the central question is November’s General Election and whether it brings policies affecting housing and taxation, particularly for investors.
There is real upside too. GDP grew 0.2% in the June quarter despite higher fuel prices, with construction leading the way. The long-awaited City Rail Link (CRL) is now open, enabling more suitable development and faster commutes for Aucklanders.
As the market expected, the Reserve Bank of New Zealand lifted the Official Cash Rate (OCR) in September. Only one more OCR review remains before the General Election, with another before the end of the year. The Monetary Policy Committee forecasts the rate rising from the current 2.75% into the 3% range in 2027, which it expects will bring inflation back within its target band. The risk to watch is the Middle East, where recent escalation in the conflict has pushed fuel prices up. Longer-term mortgage pricing follows wholesale rates rather than the OCR directly. This means rising offshore bond yields can push fixed rates higher, even while the OCR tracks as forecast.
Treasury’s Pre-Election Economic and Fiscal Update (PREFU) has cut its house price outlook once again. It now forecasts a 0.4% fall in 2026 and only a modest 0.6% recovery in 2027.
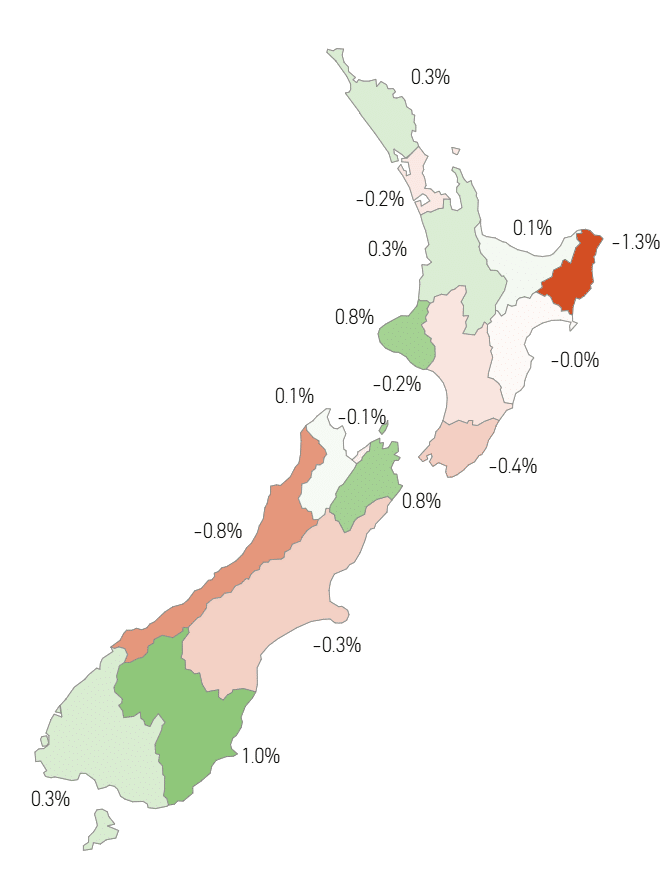
Figure 1: Valocity Value Index Monthly Movement by Region
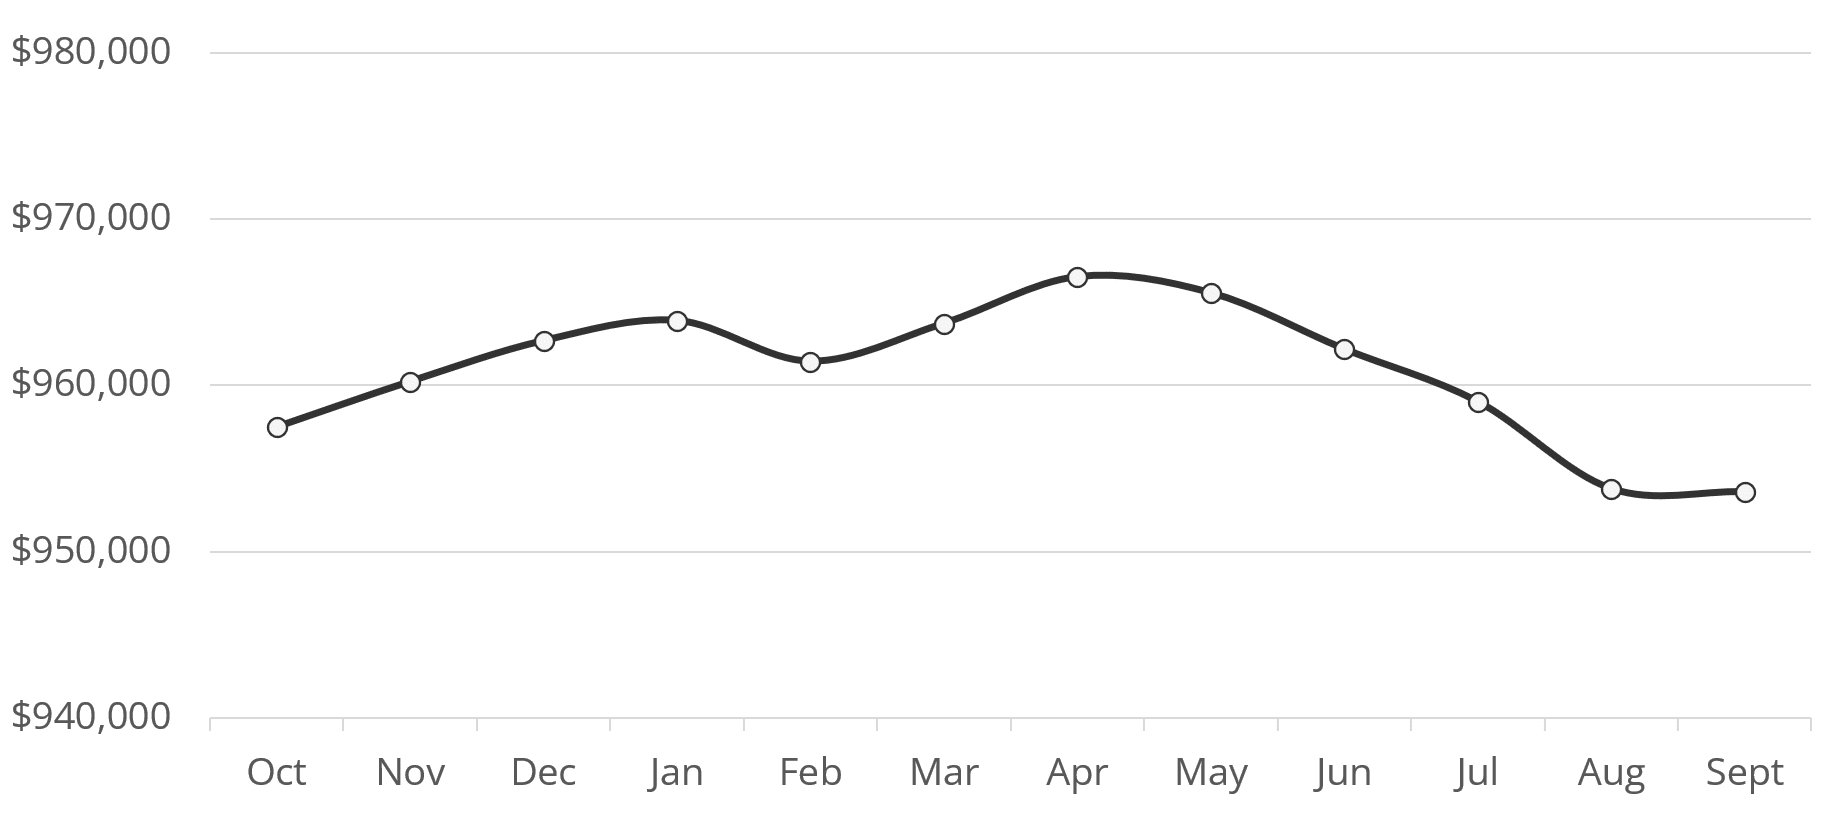
Figure 2: Valocity Value Index – New Zealand – Past 12 Months
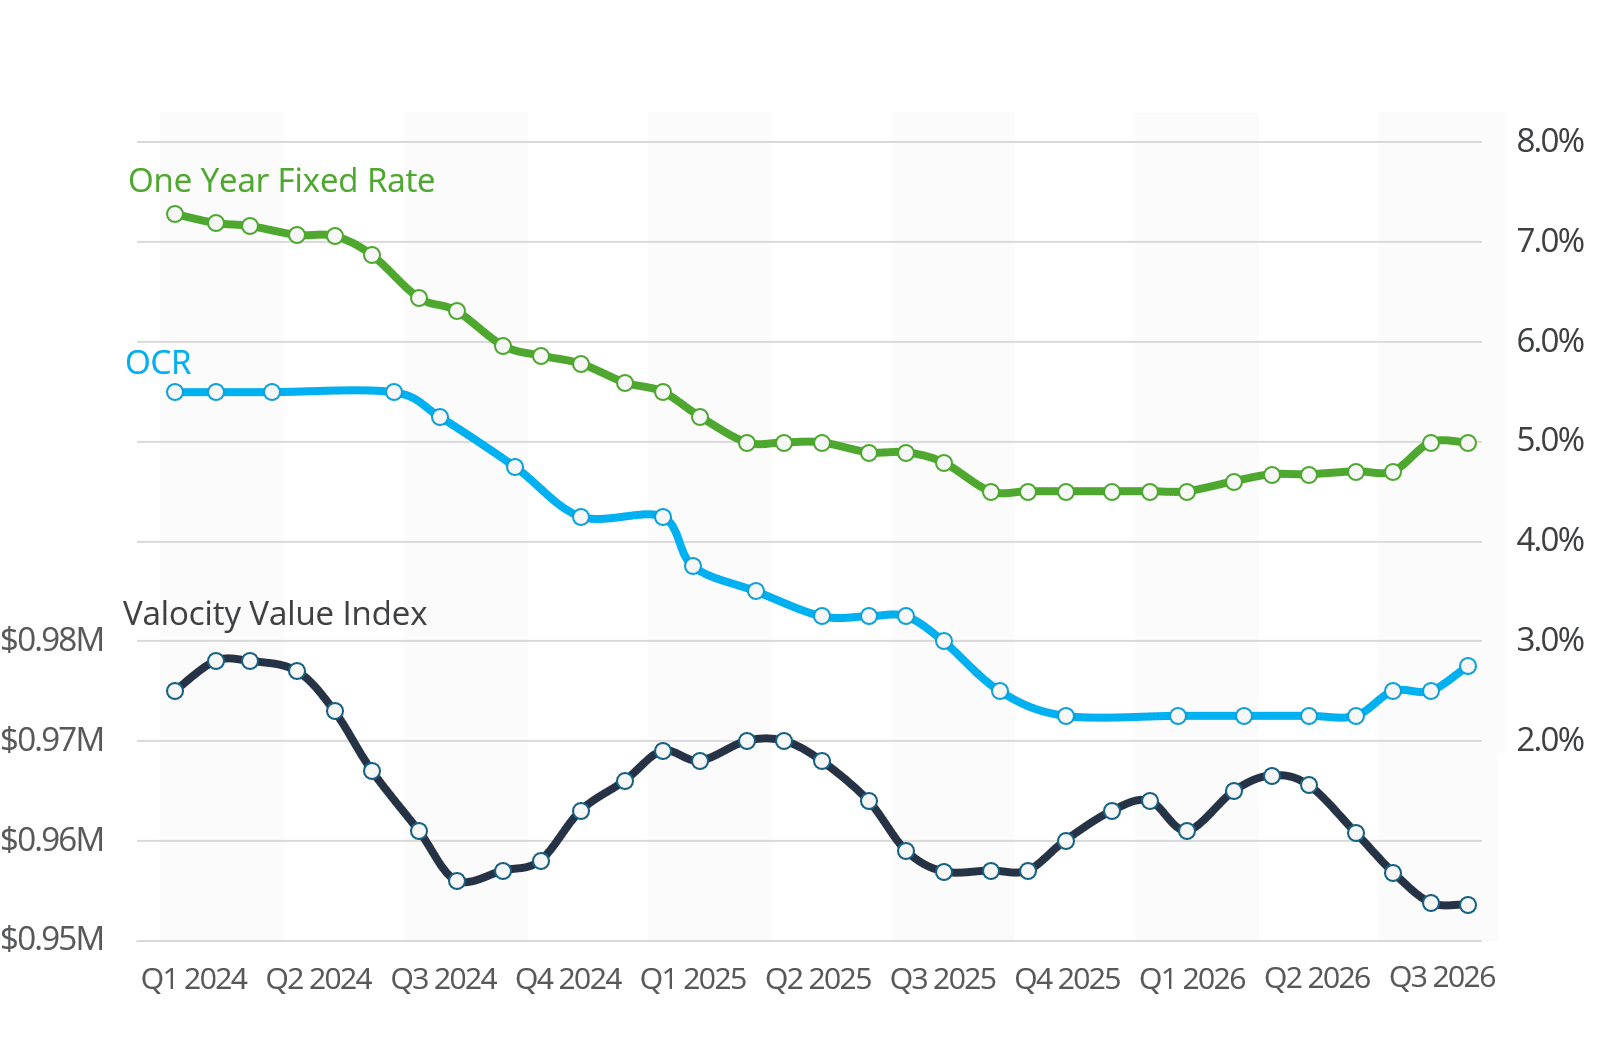
Figure 3: Valocity Value Index and Benchmark Rates
Value movement in 2026 has continued the pattern seen in 2024 and 2025, with changes remaining minimal. The Valocity Value Index is down 1% year-to-date.
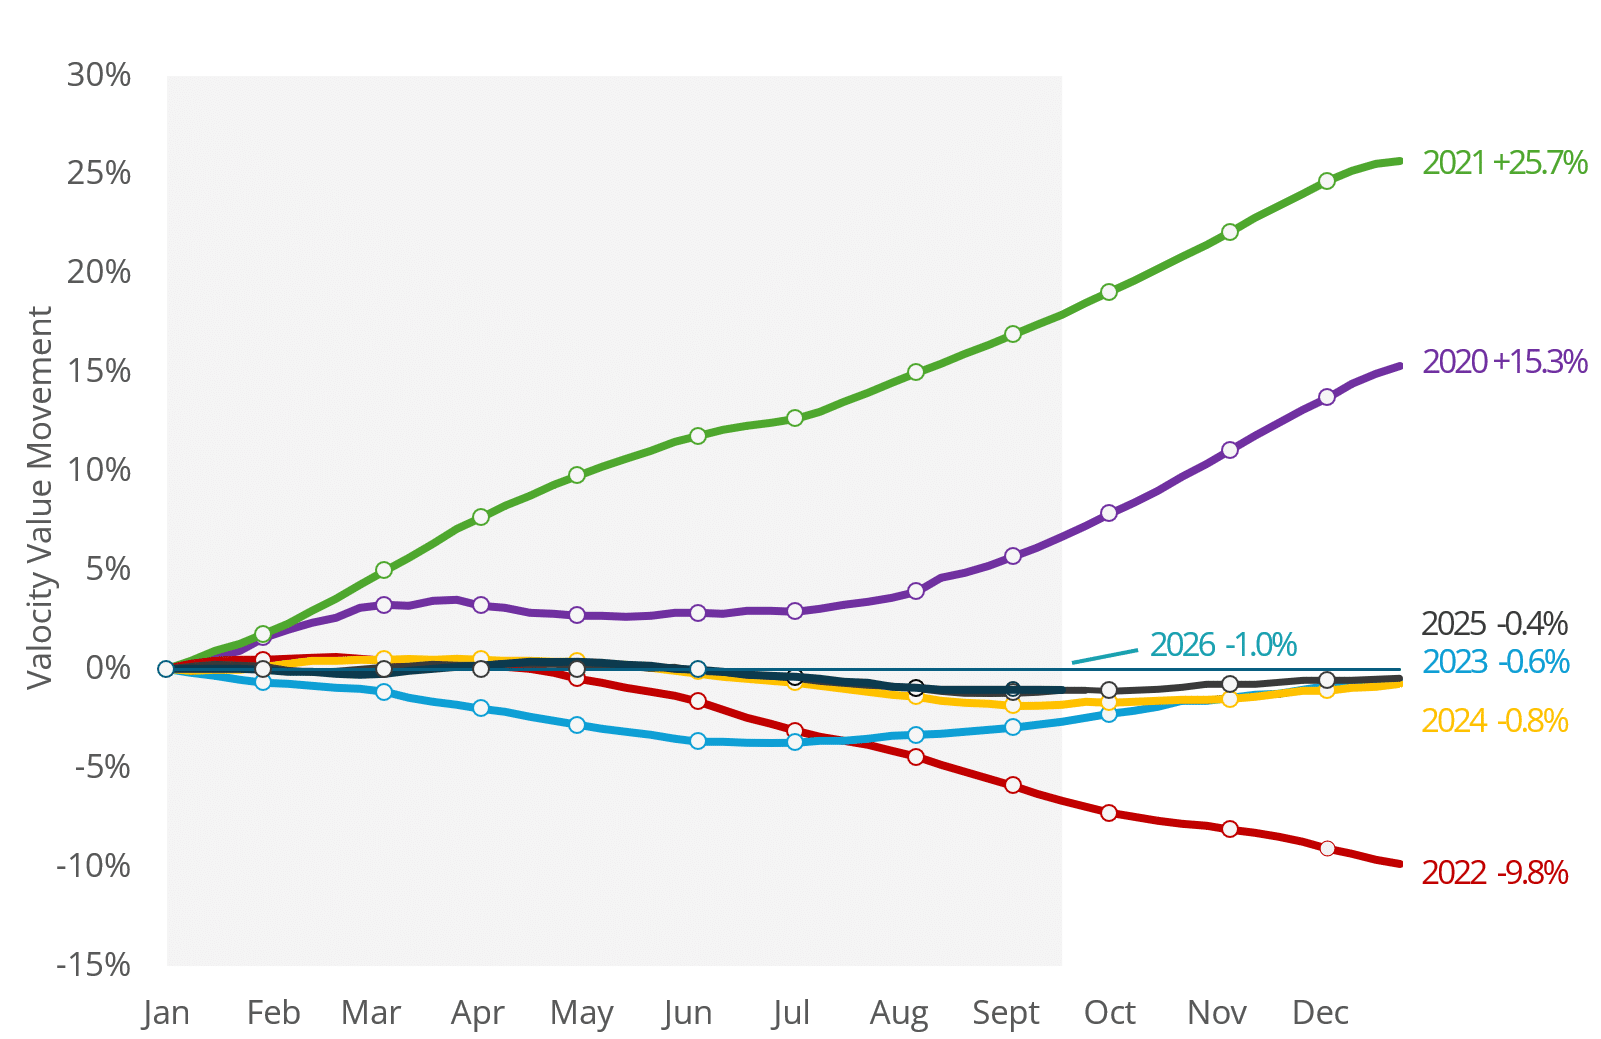
Figure 4: Valocity Value Index Movement – Year on Year Comparison
The national median sale price has fallen to $735,000 at the end of Q3 2026. Higher mortgage rates have reduced borrowing capacity, while a higher cost of living is squeezing household budgets and debt-service capacity.
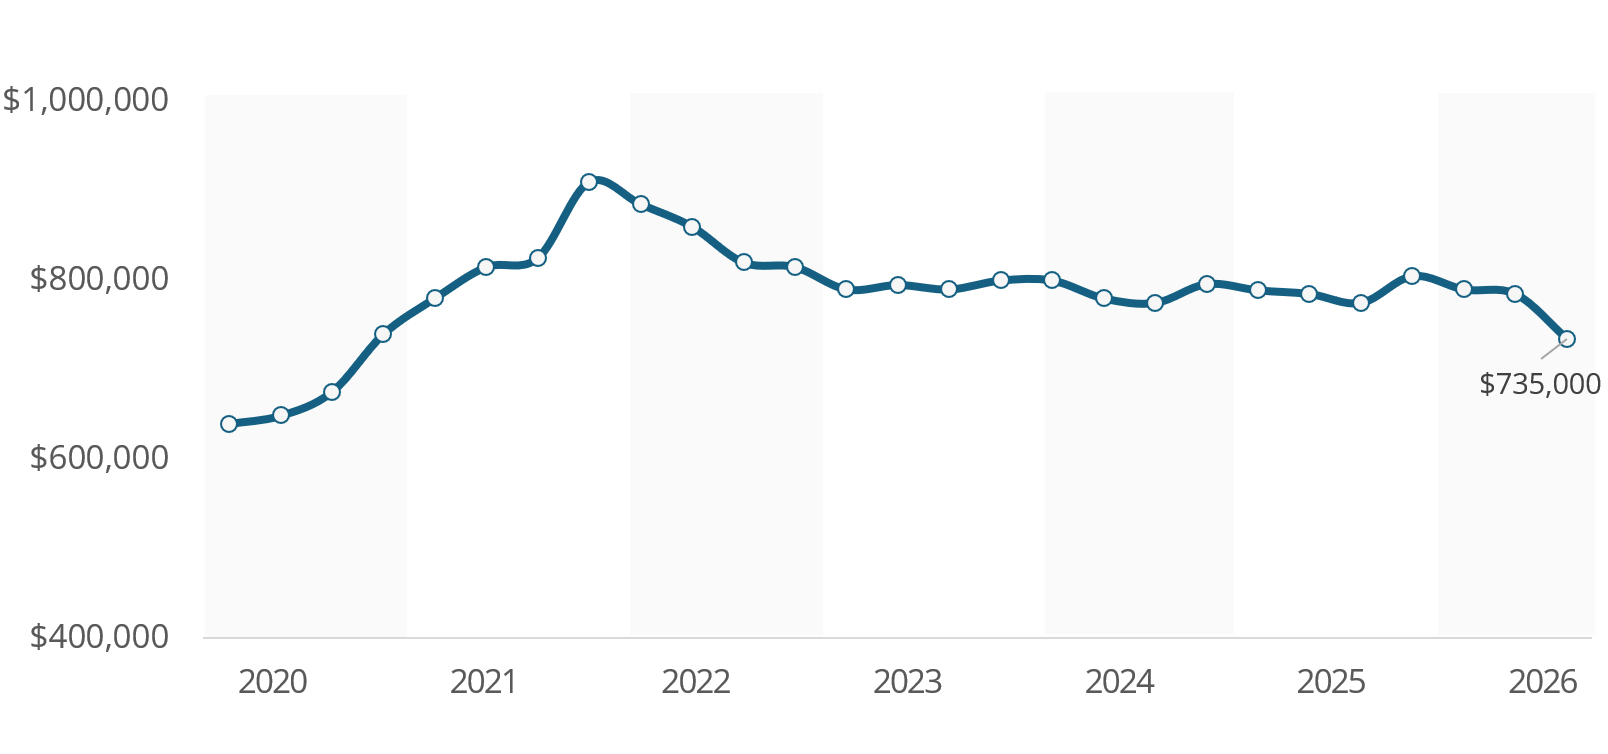
Figure 5: Median Sales Price (Settled Sales Only)
Net migration shows tentative signs of recovery, reaching 20,300 for the year ended July 2026. The improvement reflects a 4% fall in departures and a 5% rise in arrivals.
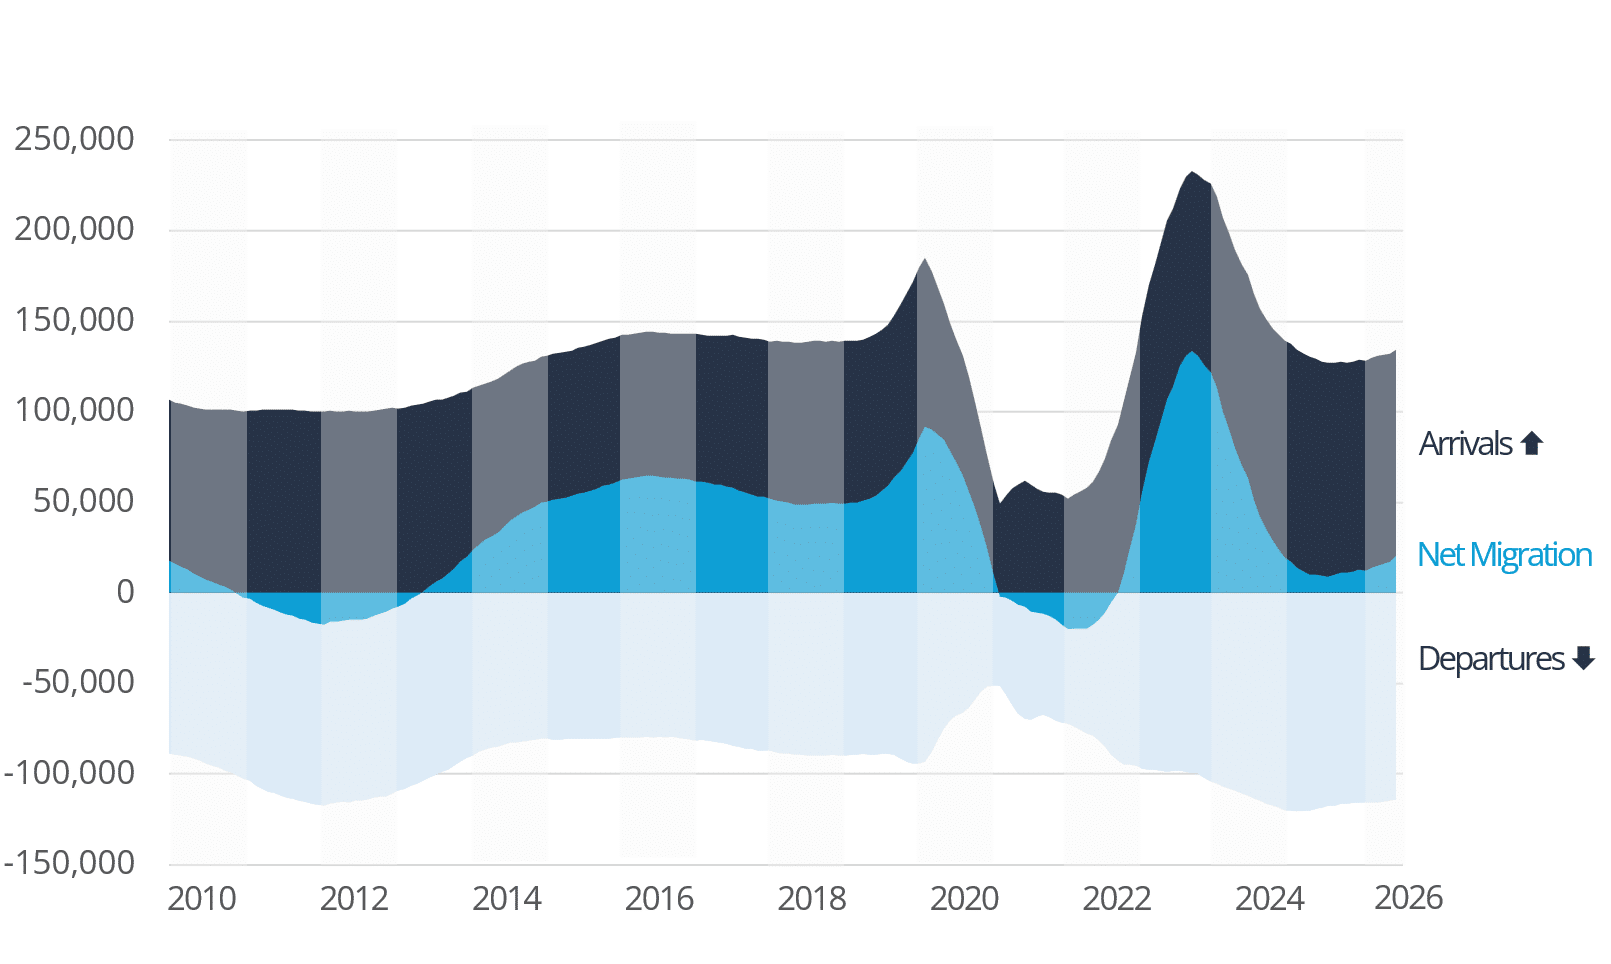
Figure 6: Annualised Net migration (Statistics NZ)
Construction pipeline
New dwelling consents reached 40,908 in the 12 months to July 2026, up 21% on the prior year and a clear signal of recovering supply. Freestanding home consents rose 20% and multi-unit consents 21%.
Auckland consented 17,260 new homes in the past year, up 20% from July 2025. Canterbury consents rose 33% over the same period.
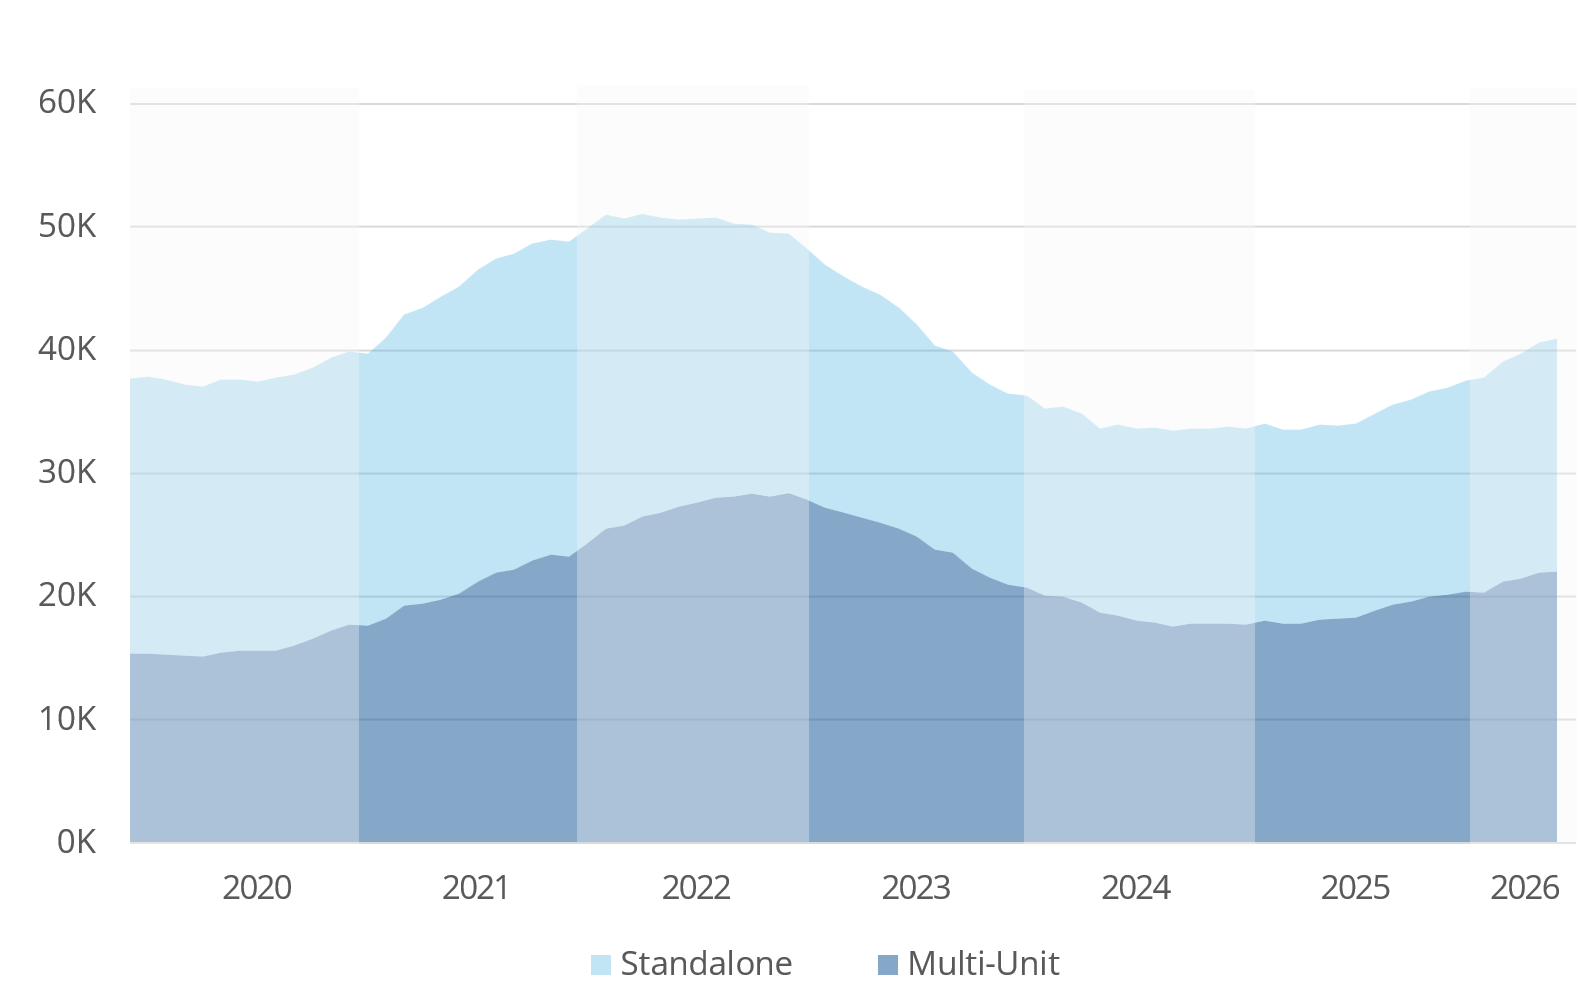
Figure 7: Composition of New Homes Consented – Annualised (Statistics NZ)
Valocity values
On the horizon
- Consumer Price Index (CPI) Update – Stats NZ – 22nd October 2026
- Monetary Policy Review – RBNZ – 28th October 2026
- General Election – 7th November 2026
- Financial Stability Report – RBNZ – 11th November 2026
For further information, or if you would like to understand more about New Zealand housing market insights please contact [email protected].