

Brought to you by Senior Research Analyst Wayne Shum
A market on pause: two regions climb, the rest dipped
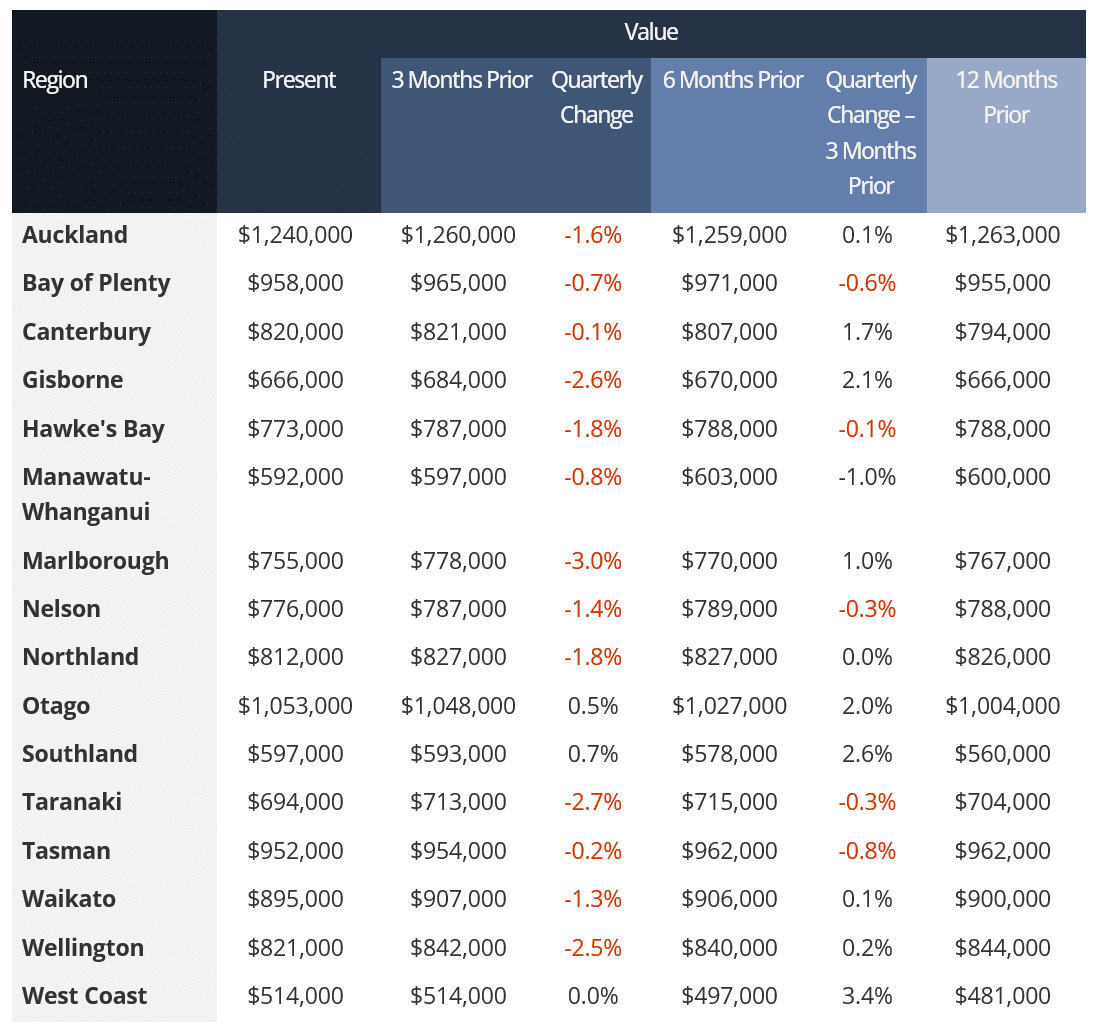
The national Valocity Value Index fell 1.1% over the quarter to $954,000, just $11,000 above the post-Covid trough of $943,000 in March 2023. Values have been flat for three years, moving within a narrow band of $35,000 since the beginning of 2023. Only Southland and Otago recorded quarterly value growth, though both sit below their historic peak at the end of June. Nationally, the index fell 0.4% over the month.
Several drivers are shaping the market. Mortgage rates have risen since before the Middle East conflict, delaying the economic recovery. Mortgage rates rose again in August, responding to higher wholesale rates and the highest inflation since late 2023, at 4.1%, while unemployment was at a 15-year high of 5.6%. Many buyers have adopted a “wait and see” approach ahead of the General Election.
The Reserve Bank of New Zealand held its Loan to Value Ratio (LVR) and Debt to Income settings in August, noting that housing risks are currently contained, with prices broadly flat, lending growth modest, and the share of higher-risk lending manageable. For investors, up to 10% of new lending can have an LVR above 70%. For owner-occupiers, up to 25% of new lending can have an LVR above 80%. In the second quarter of 2026, 53% of First Home Buyer lending commitments were at or above 80% LVR, reflecting First Home Buyers’ desire to enter the market.
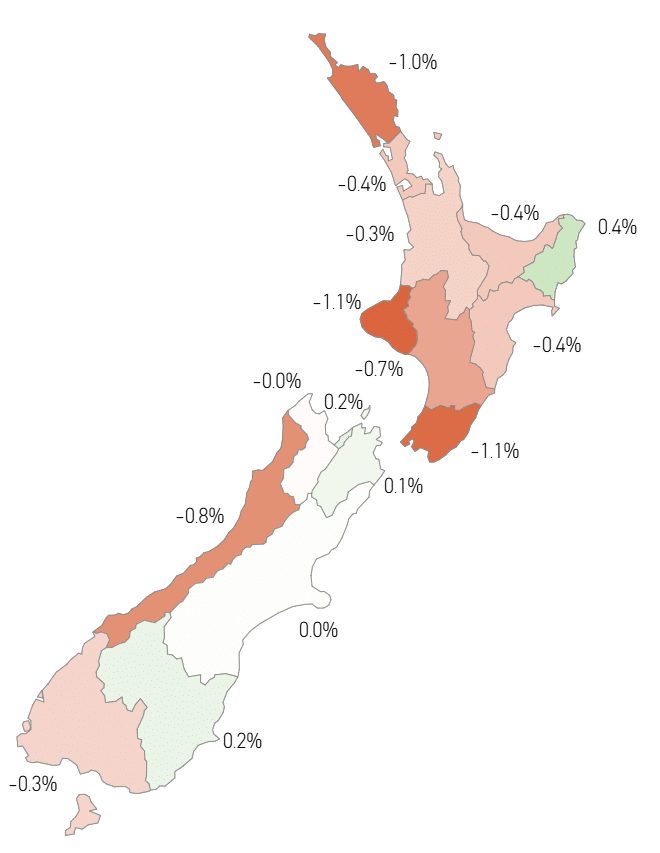
Figure 1: Valocity Value Index Monthly Movement by Region
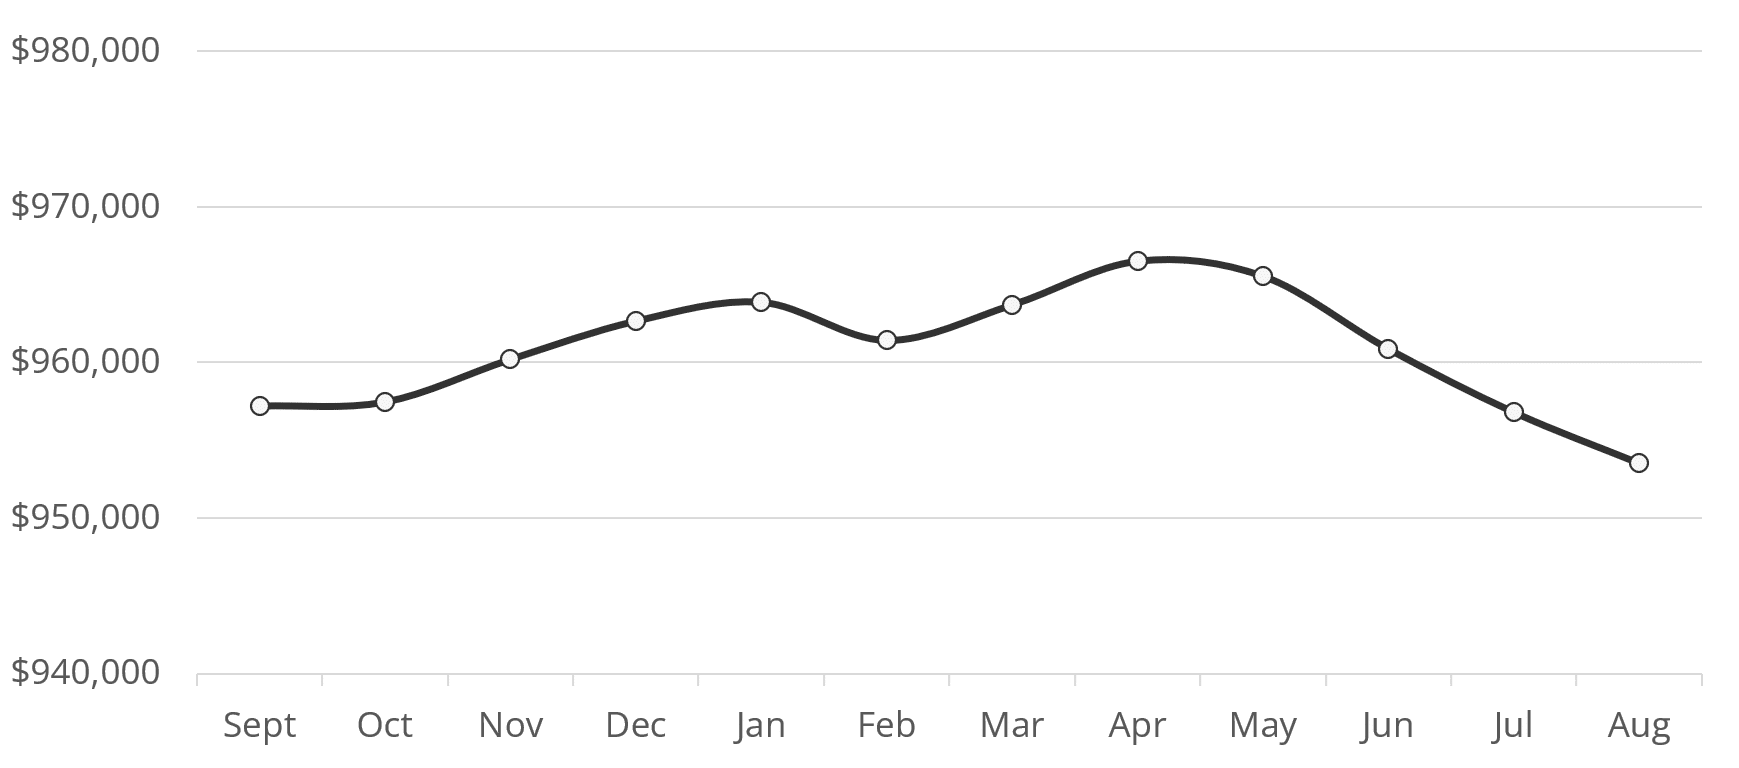
Figure 2: Valocity Value Index – New Zealand – Past 12 Months
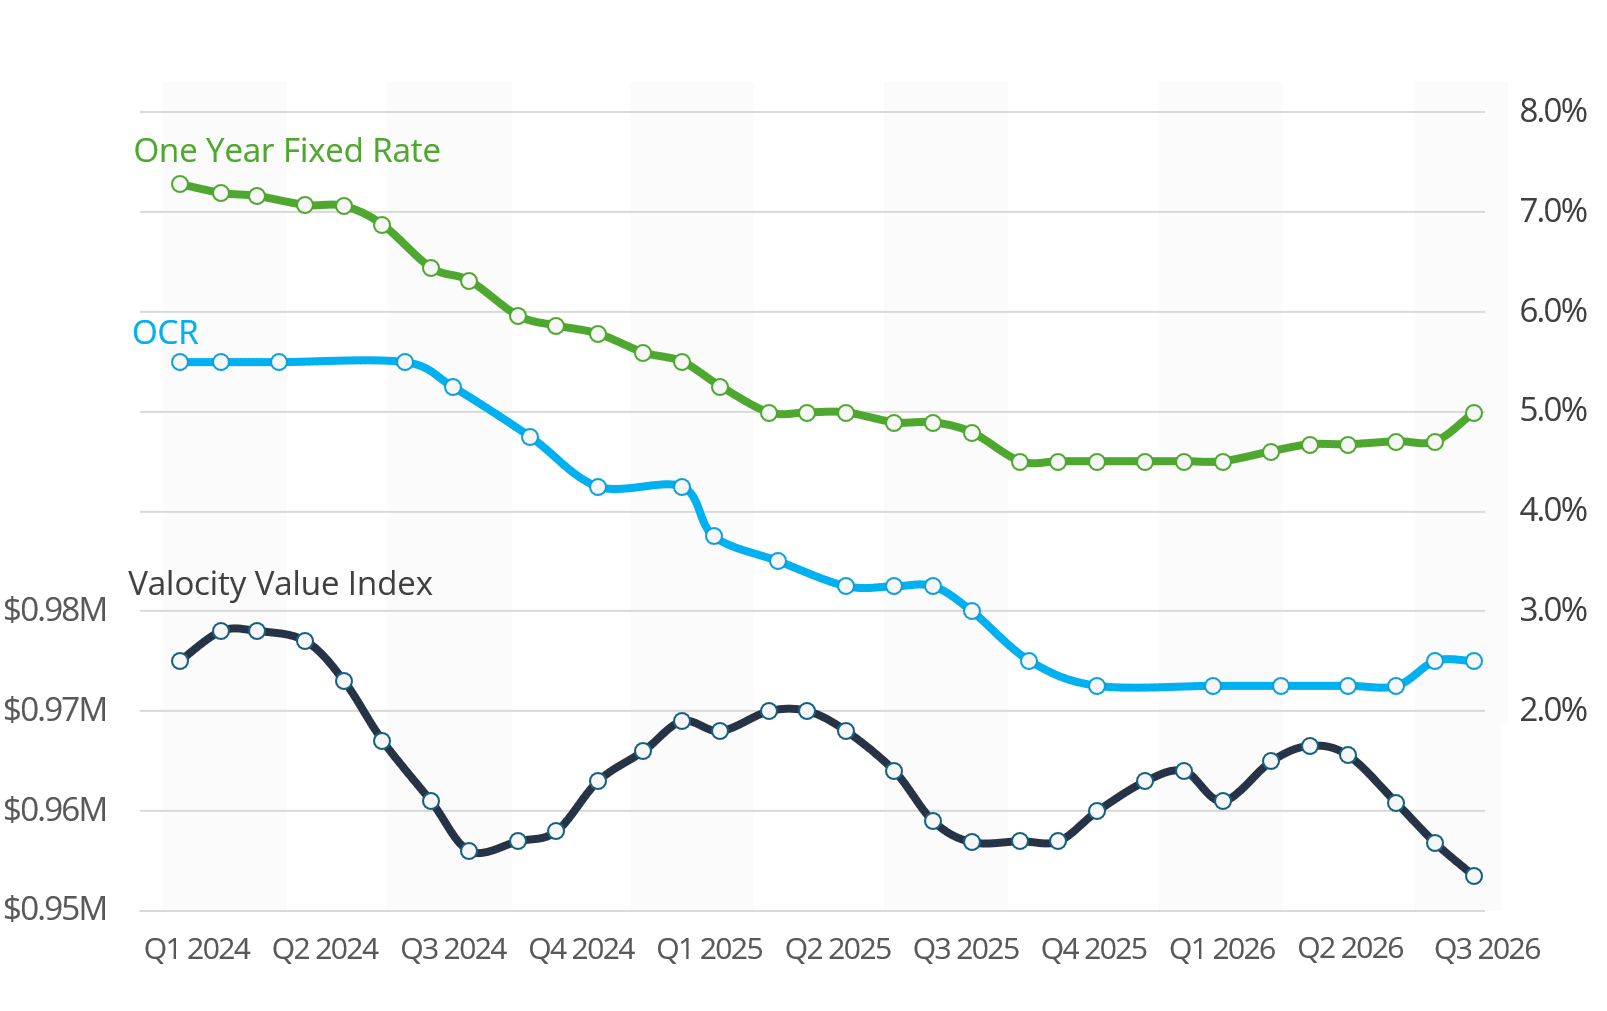
Figure 3: Valocity Value Index and Benchmark Rates
Value movement in 2026 has continued the pattern seen in 2024 and 2025, with changes remaining minimal. The Valocity Value Index is down 1% year-to-date.
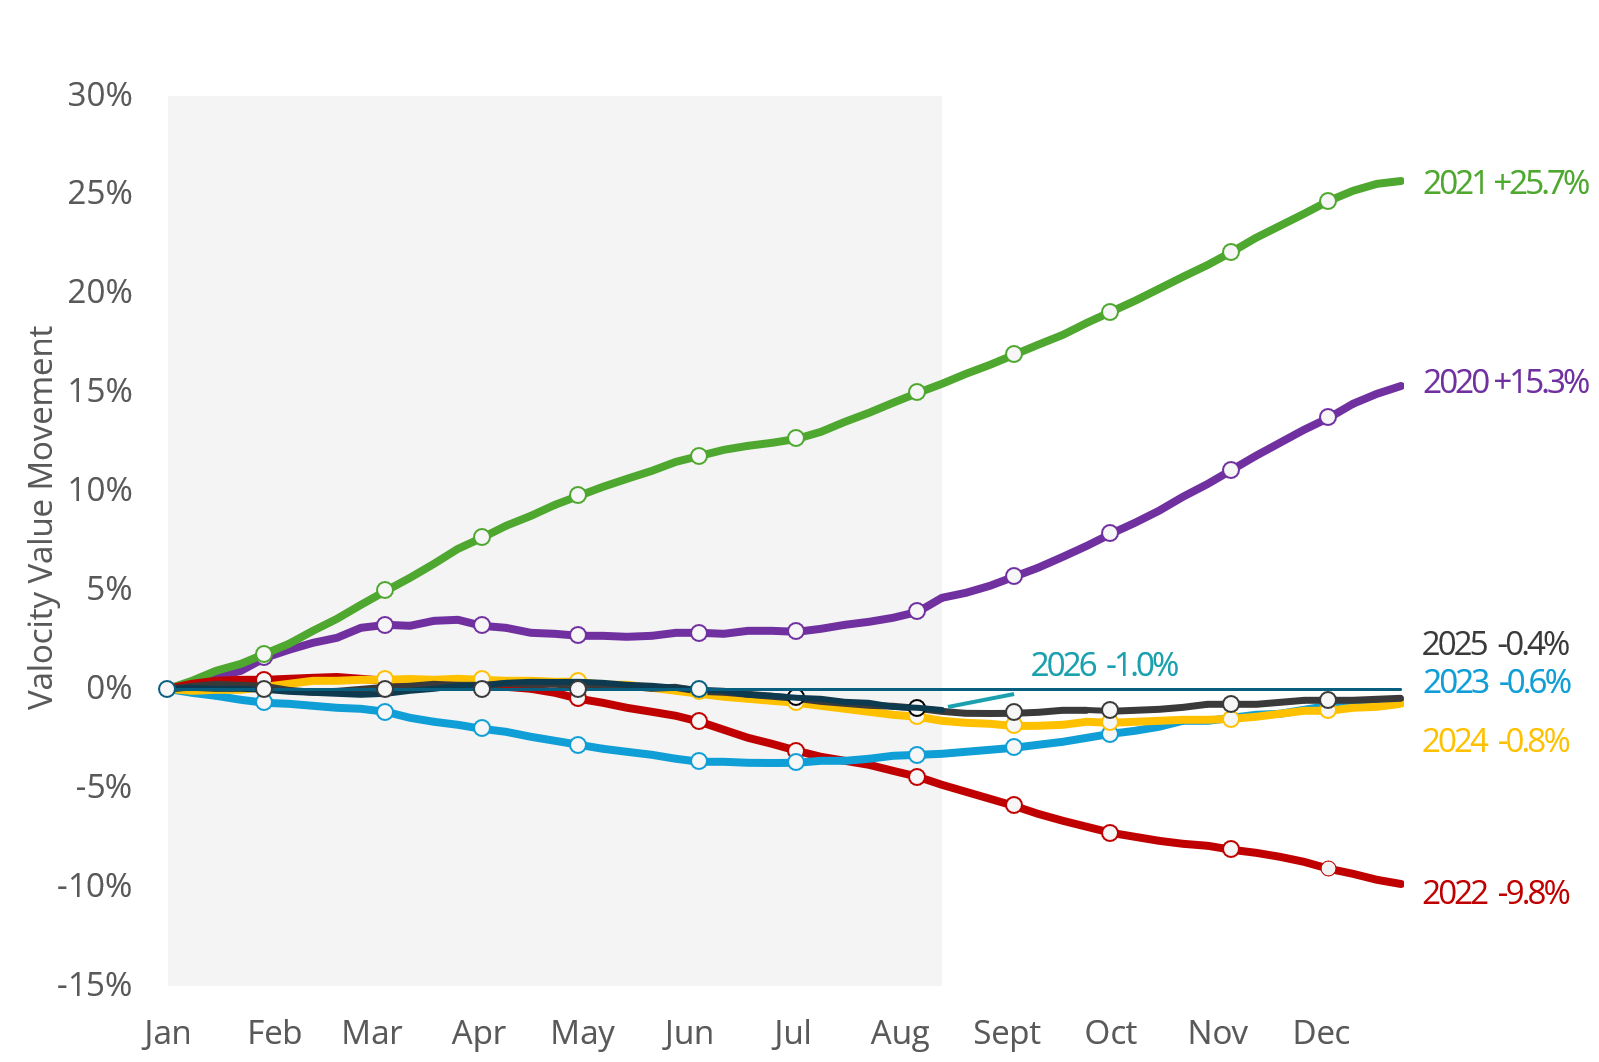
Figure 4: Valocity Value Index Movement – Year on Year Comparison
The national median sale price fell to $720,000 in Q3 2026. Higher mortgage rates have reduced borrowing capacity, while a higher cost of living is squeezing household budgets and debt-service capacity
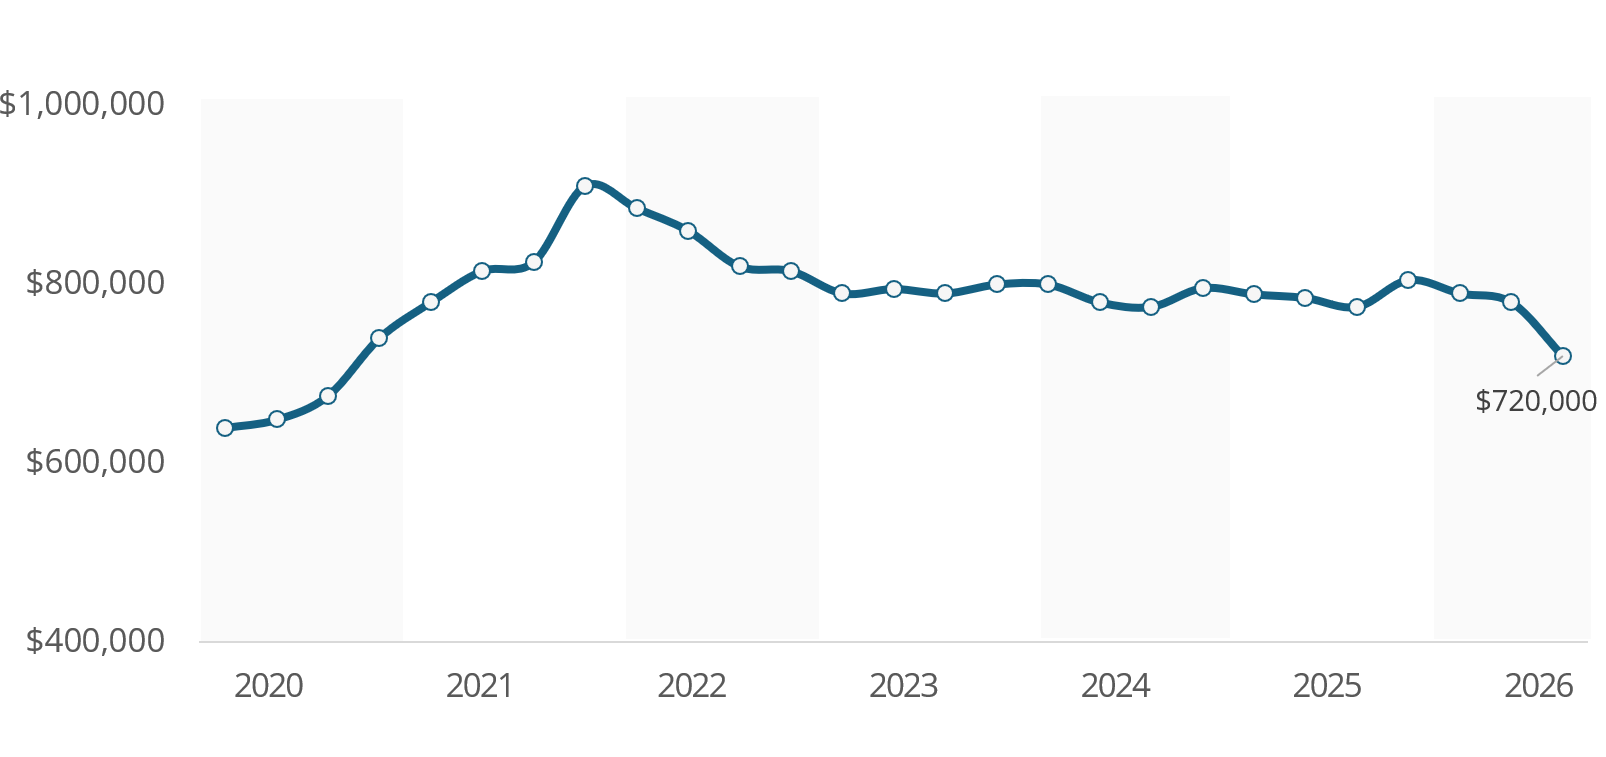
Figure 5: Median Sales Price (Settled Sales Only)
Net migration shows tentative signs of recovery, reaching 17,600 for the year ended June 2026. The improvement reflects a 5% fall in departures and a 1% rise in arrivals.
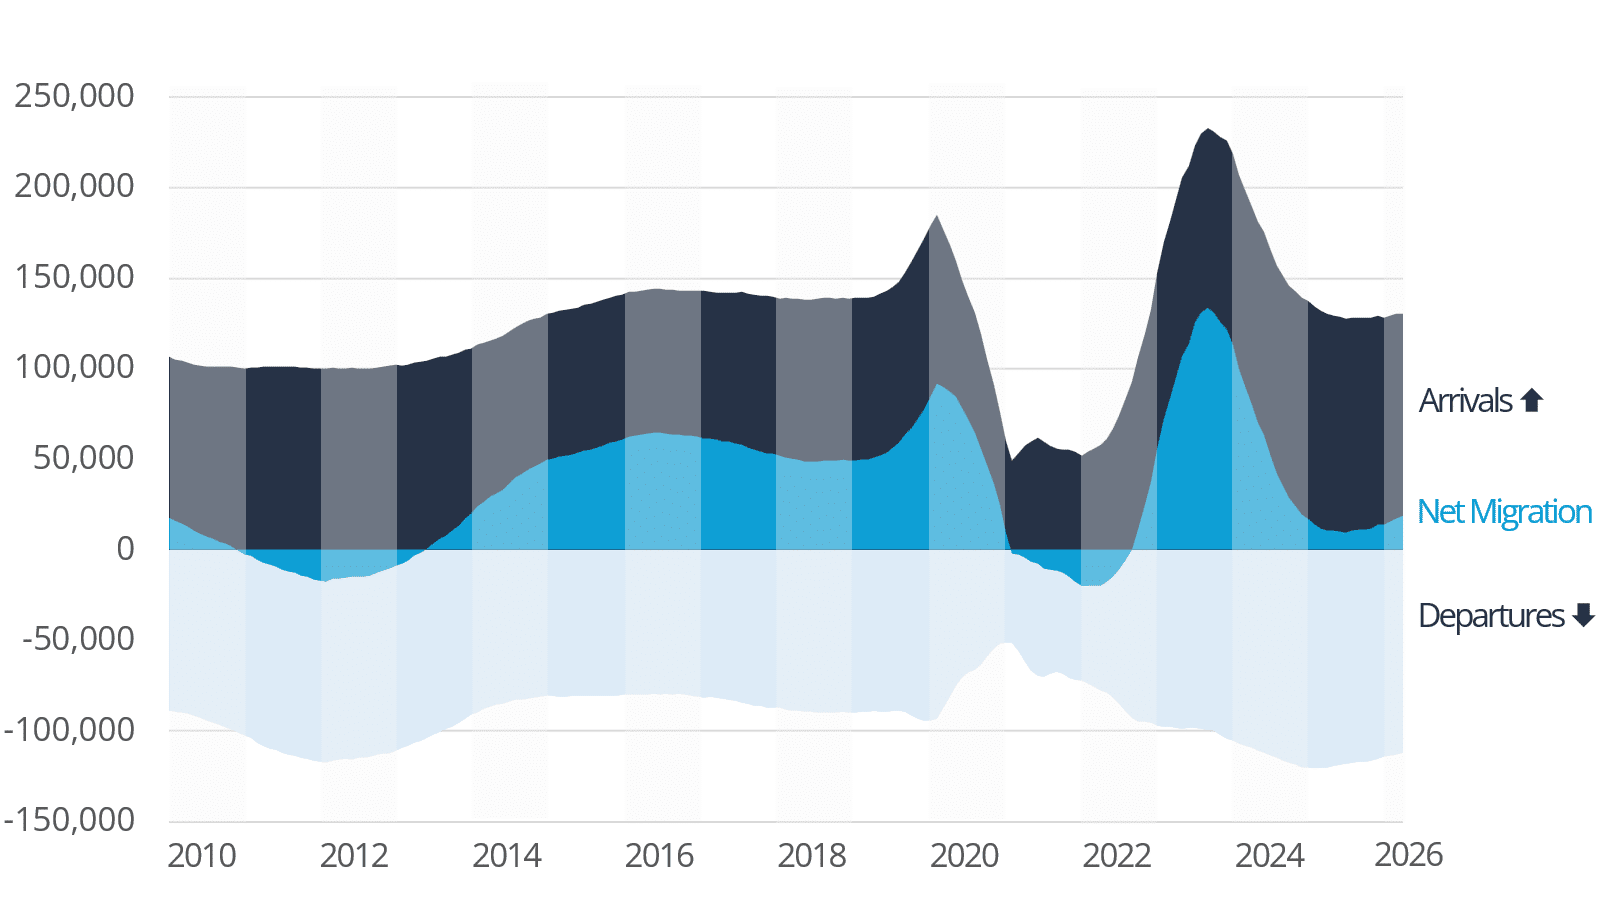
Figure 6: Annualised Net migration (Statistics NZ)
Construction pipeline
New dwelling consents reached 40,581 in the 12 months to June 2026, up 19% on the prior year and a clear signal of recovering supply. The volume surpassed 40,000 for the first time since September 2023.
Freestanding homes consented rose by 17% and multi-unit homes by 21%.
Auckland consented 17,097 new homes in the past year, up 20% from June 2025. Queenstown-Lakes consented more than 2,000 new homes for the first time.
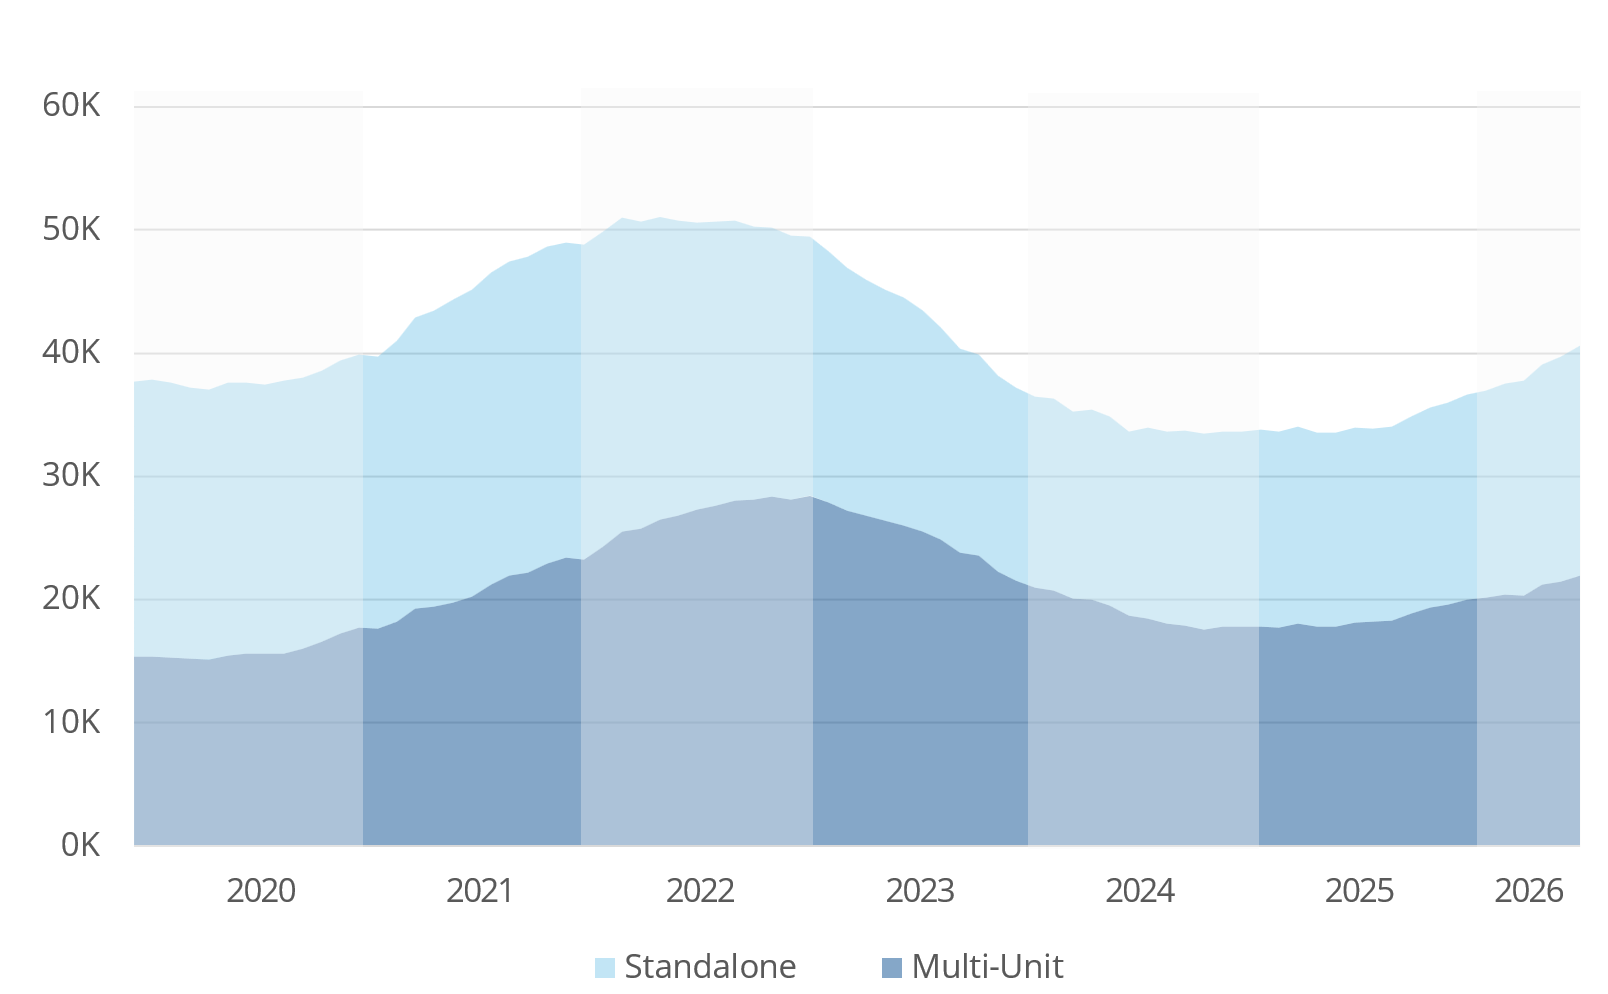
Figure 7: Composition of New Homes Consented – Annualised (Statistics NZ)
Valocity values
On the horizon
- Monetary Policy Statement – 2nd September 2026
- Gross Domestic Product Update – 17th September 2026
- Consumer Price Index (CPI) Update – 22nd October 2026
- General Election – 7th November 2026
For further information, or if you would like to understand more about New Zealand housing market insights please contact [email protected].