

Brought to you by Senior Research Analyst Wayne Shum
A two-speed market: rural strength, urban hesitancy
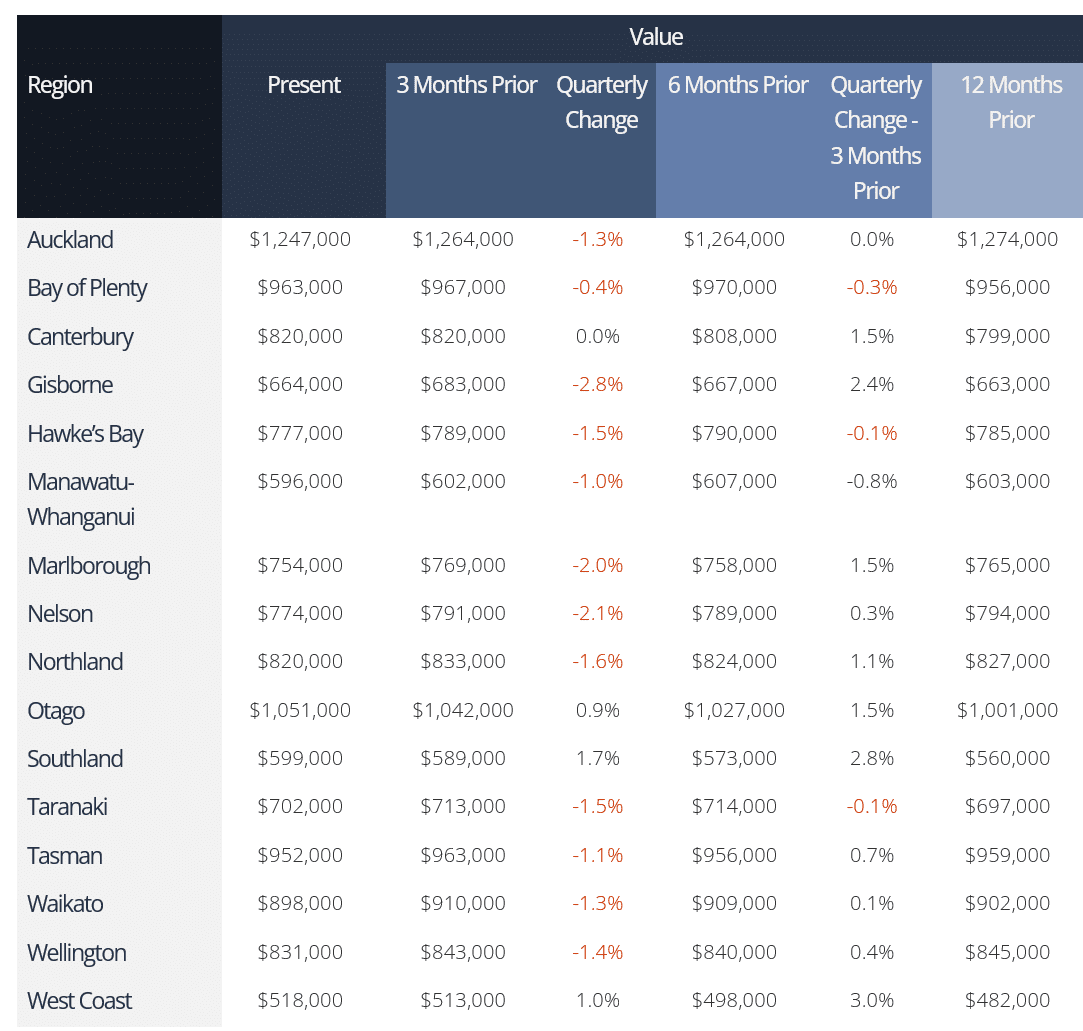
The national Valocity Value Index eased 0.9% over the quarter and 0.3% over the month. Twelve of the 16 regions recorded quarterly declines, alongside 46 of the 66 territorial authorities. Otago, Southland, and the West Coast were the exceptions, supported by a strong rural sector, while Canterbury held steady. Only Canterbury saw monthly growth over July (+0.5%).
The regional divergence continued. Of the seven regions with annual growth, the top four were in the South Island, underpinned by the strong rural sector and the one-off $3.2 billion dairy payout. Otago’s strong performance was driven by the growth in Queenstown-Lakes. Auckland, Wellington, and Nelson remained the weakest performing regions, plagued by a weak employment market.
The Reserve Bank lifted the OCR by 0.25% to 2.5%, as many had expected, and mortgage rates have edged up in response. The temporary ceasefire in the Middle East has offered little relief, with fuel prices rising again and inflation unlikely to ease in the near term. CPI now sits at 4.1%, its highest level in two years, up from 3.1% at the end of March. The rise reflects conflict-related price increases. The jump was higher than the RBNZ forecast of 3.9% but within market expectations. Fuel accounted for nearly a quarter of the rise, with electricity and council rates the other main drivers.
Headwinds and caution defined the market as it entered winter, particularly in the urban centres with weak employment and higher price levels. Higher mortgage rates, combined with a higher cost of living, have deterred some buyers.
The upcoming General Election is also holding back activity, as the property investment landscape may change depending on the government elected. Listing volumes and housing inventory remain elevated, so potential buyers are not feeling the need to act urgently.
First home buyers remain the dominant buyer group, particularly as investors remain on the sidelines until investment fundamentals improve. KiwiSaver withdrawals for first-home purchases in March surpassed their previous peak in 2017.
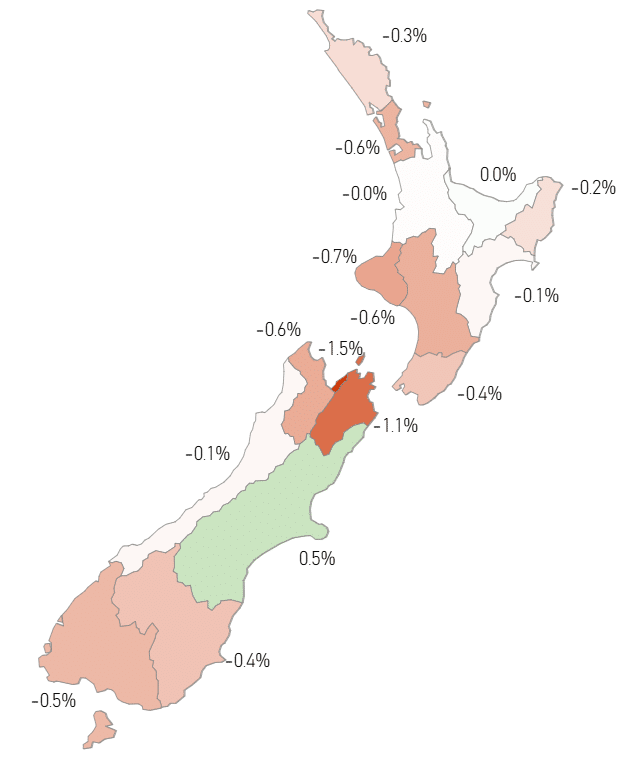
Figure 1: Valocity Value Index Monthly Movement by Region
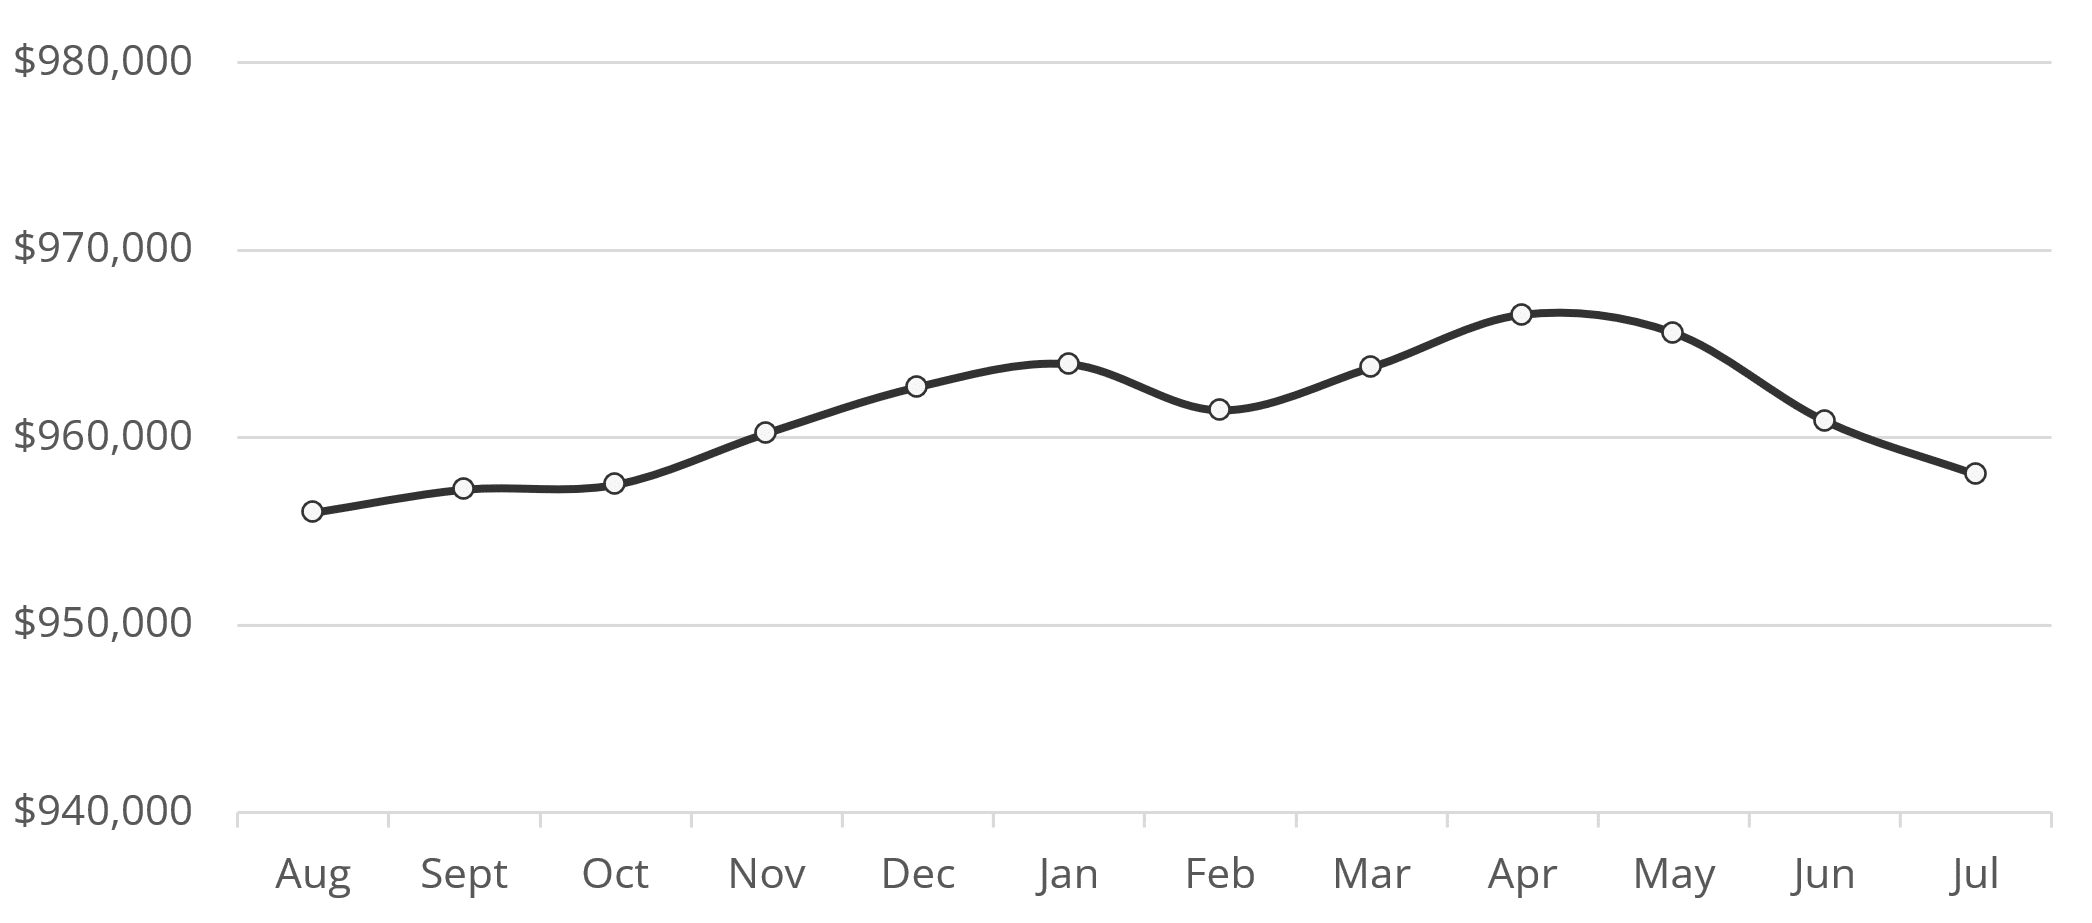
Figure 2: Valocity Value Index – New Zealand – Past 12 Months
Mortgage rates moved higher at the end of July as wholesale rates rose in response to the turmoil in the Middle East. While some of the increases have already been priced in, rises are still expected.
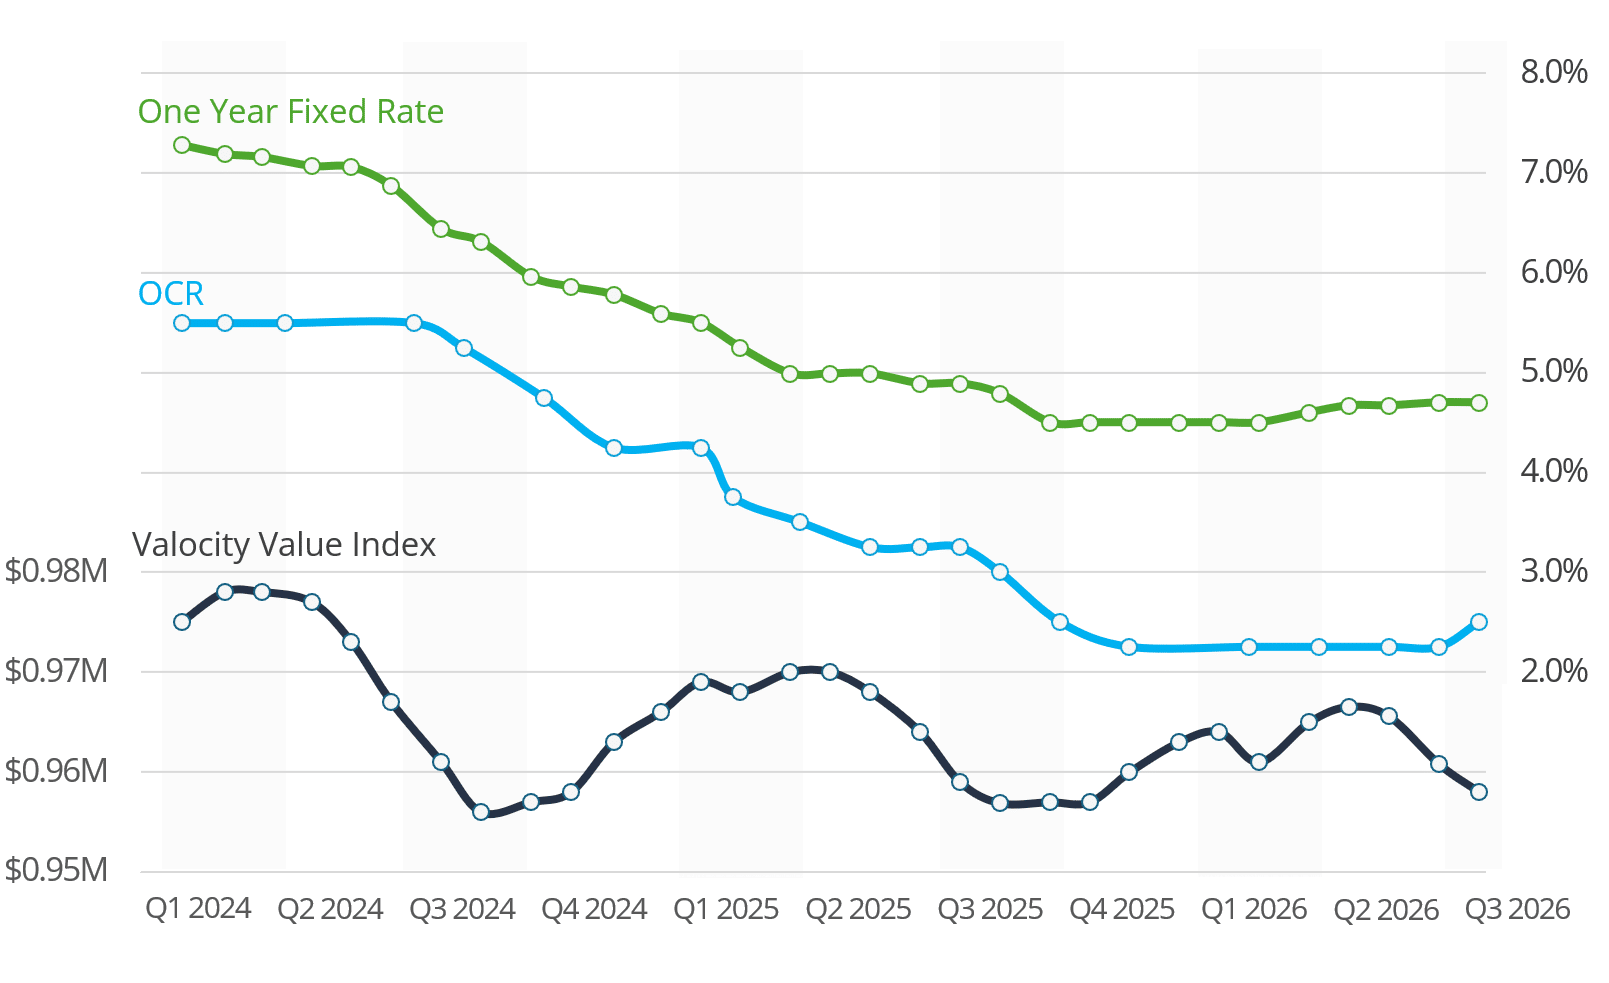
Figure 3: Valocity Value Index and Benchmark Rates
Value movement in 2026 has continued the pattern seen in 2024 and 2025, with changes remaining minimal.
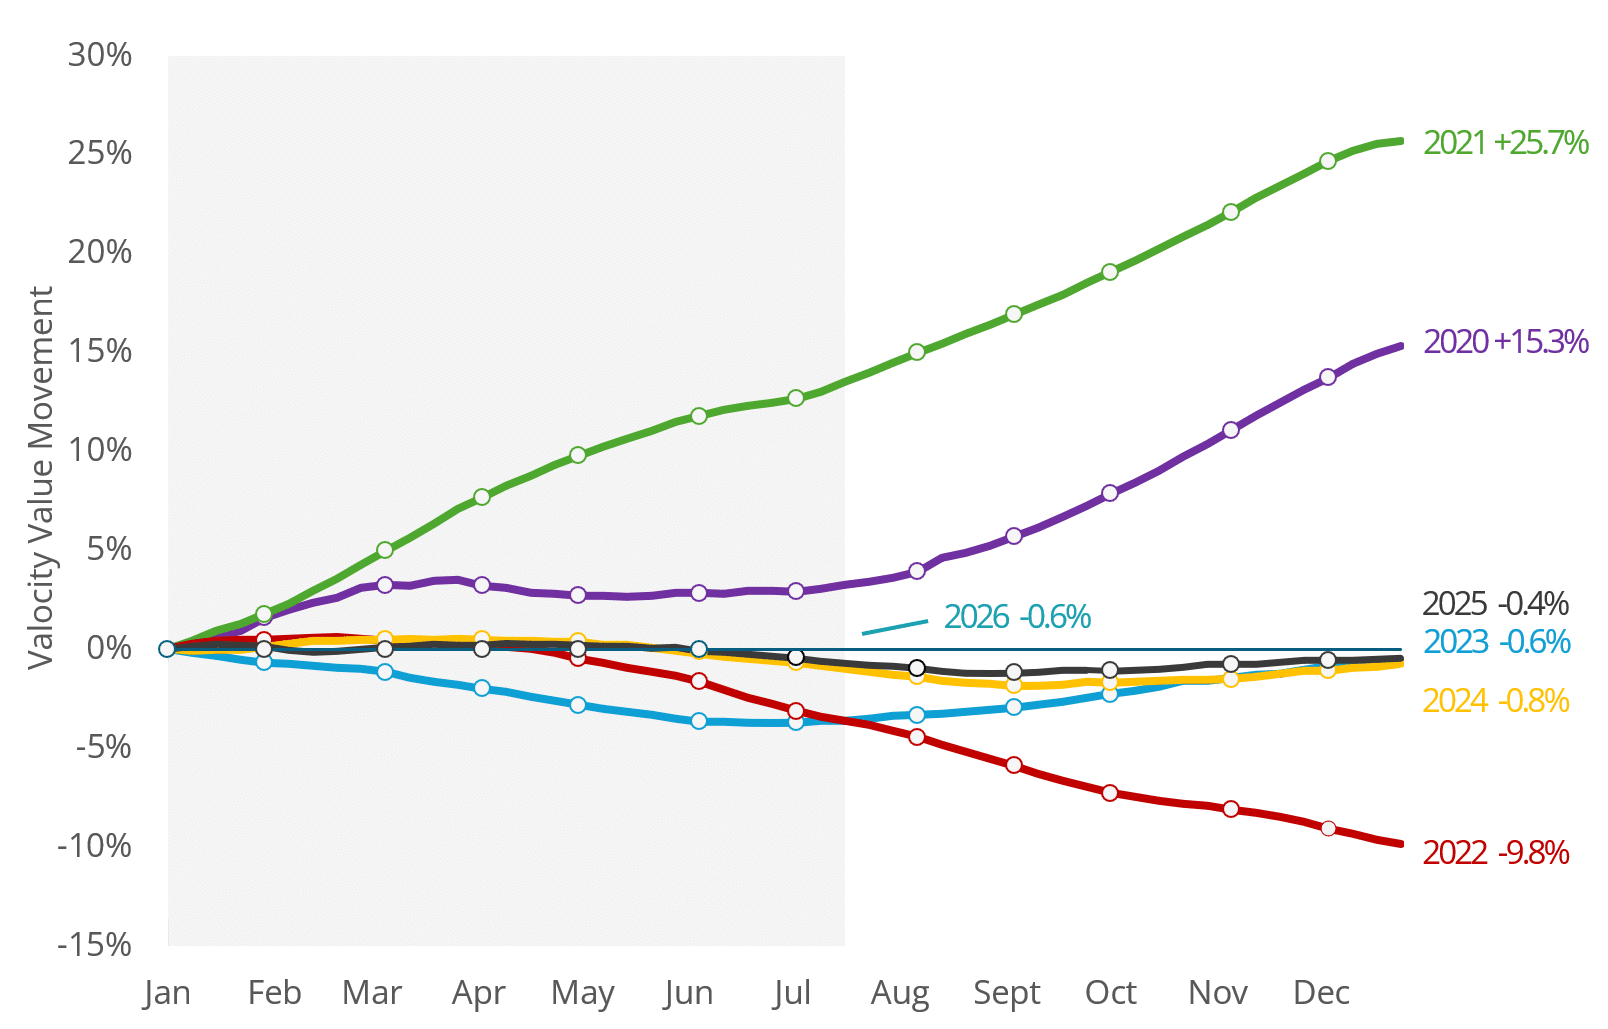
Figure 4: Valocity Value Index Movement – Year on Year Comparison
The national median sale price has fallen to $777,000 in Q2 2026, with the momentum from the latter half of 2025 now dissipated.
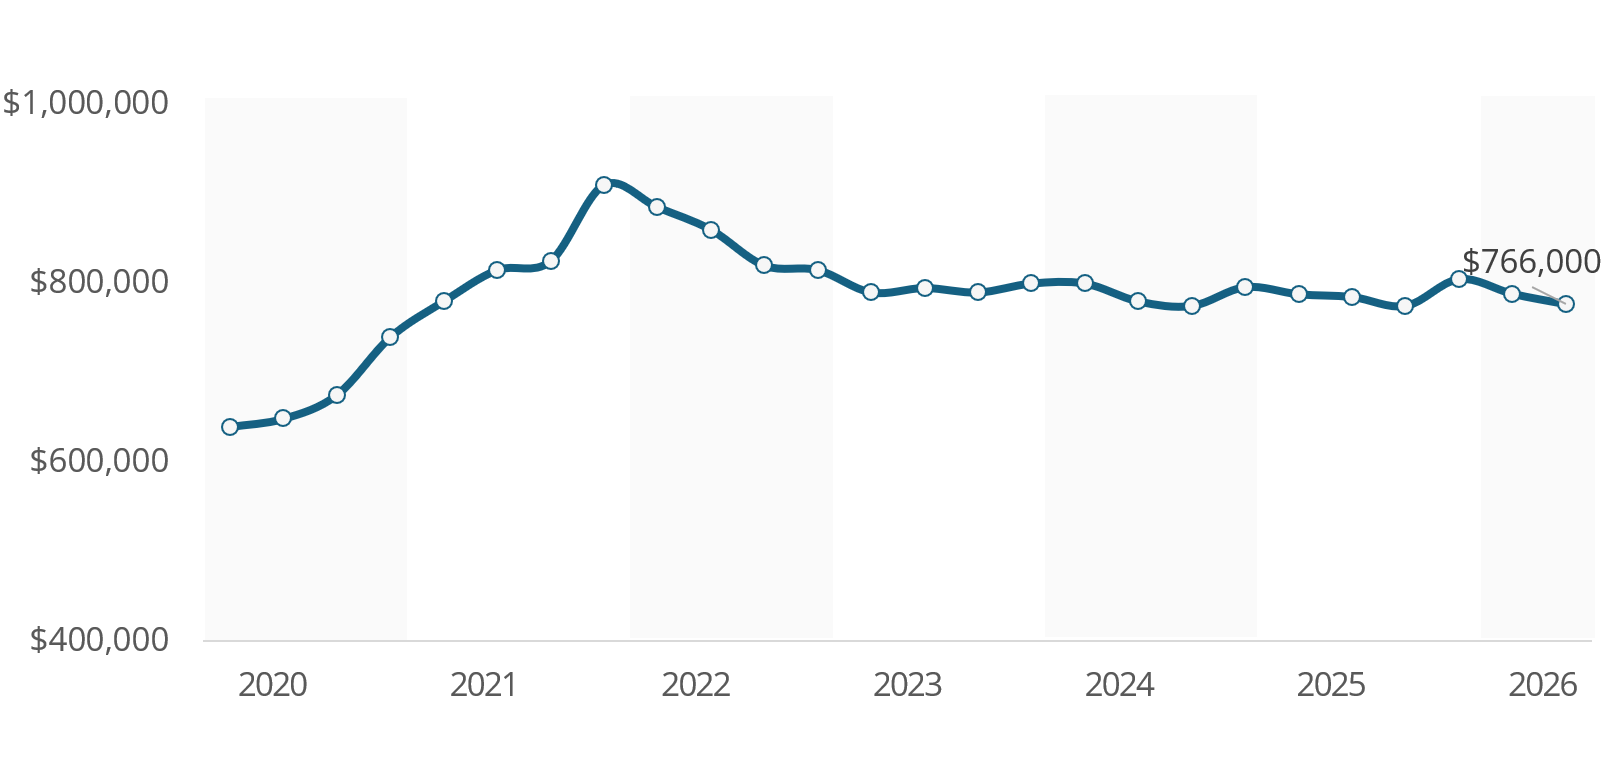
Figure 5: Median Sales Price (Settled Sales Only)
Net migration showed tentative signs of recovery, reaching 18,800 for the year ended May 2026. Departures have been easing while arrivals slowly rise.
The net migration loss to Australia was 28,500 for the year ended 2025, with 47,500 departures against 19,000 arrivals. A net migration loss to Australia is not new. It averaged about 30,000 a year from 2004 to 2013, and 3,000 a year from 2014 to 2019.
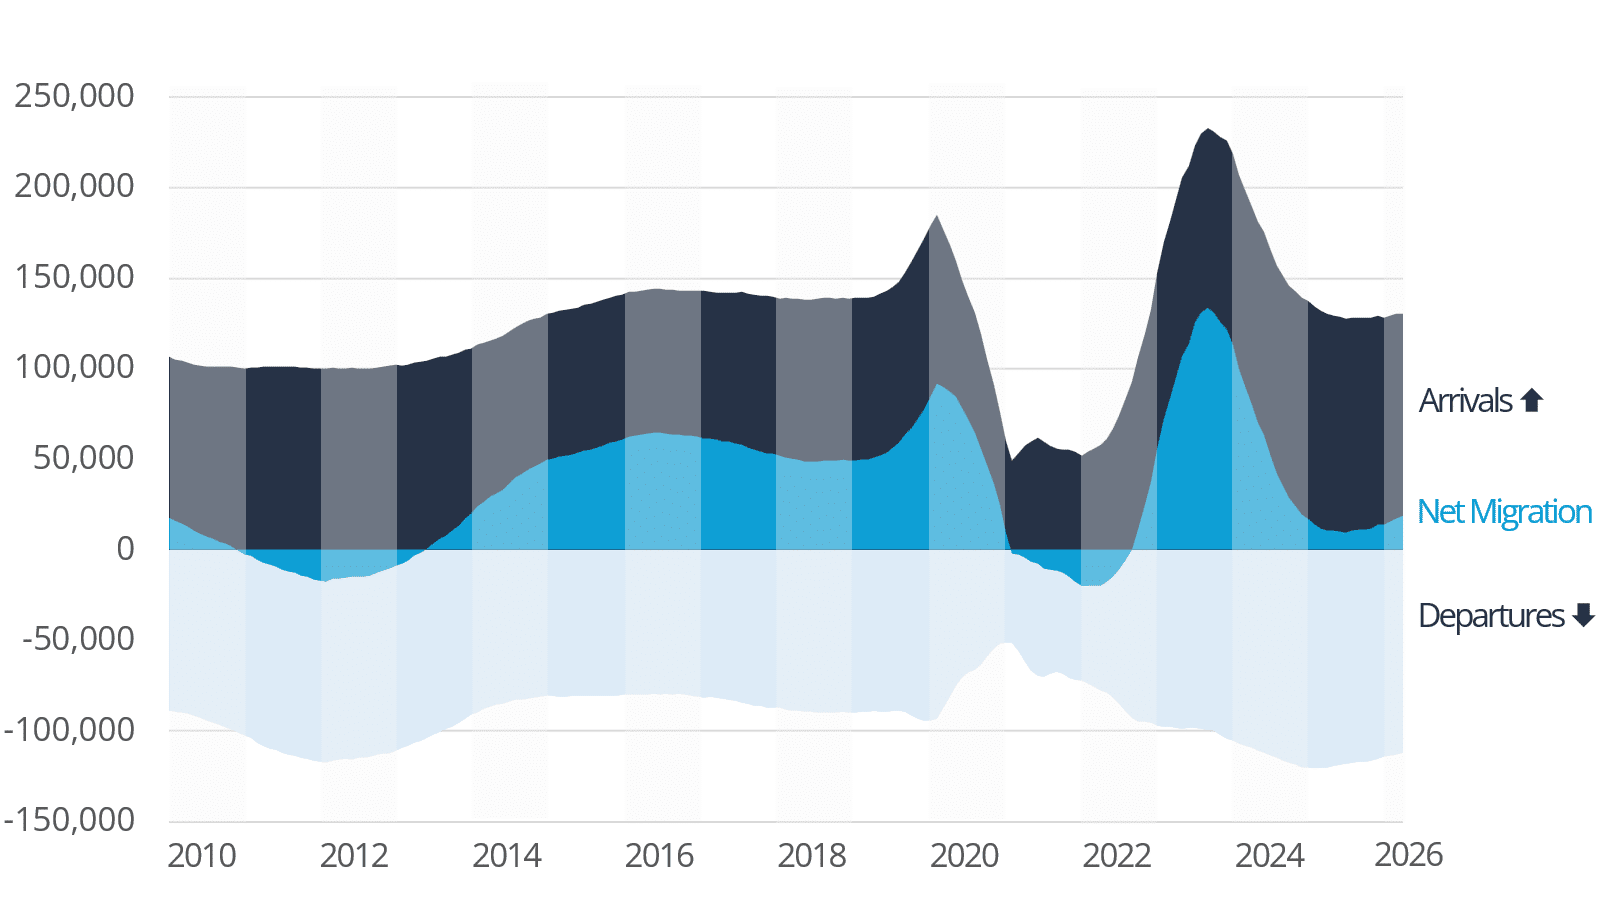
Figure 6: Annualised Net migration (Statistics NZ)
Construction
New dwelling consents reached 39,737 in the 12 months to May 2026, up 17% on the prior year and a clear signal of recovering supply. That remains below the more than 40,000 consented in 2023, but momentum is returning to the sector.
Auckland continues to lead the shift to higher-density housing. Multi-unit consents there reached 11,084, close to a quarter of all new homes consented nationally and up 17% on the year to May 2025. That strength holds even as the wider townhouse sector softens. Many of these projects replace earlier consents that did not proceed. Since the 2022 peak, developers have refined their understanding of which townhouse types and features drive value and, ultimately, a sale. The region’s planning rules reinforce the trend, and for many sites a townhouse is the only profitable way to build.
Cost pressure remains a constraint. June’s Consumer Price Index showed the cost of building a new house rose 1.6% over the quarter and 2.7% for the year, its sharpest quarterly increase since December 2022, driven by higher materials, fuel, and labour costs.
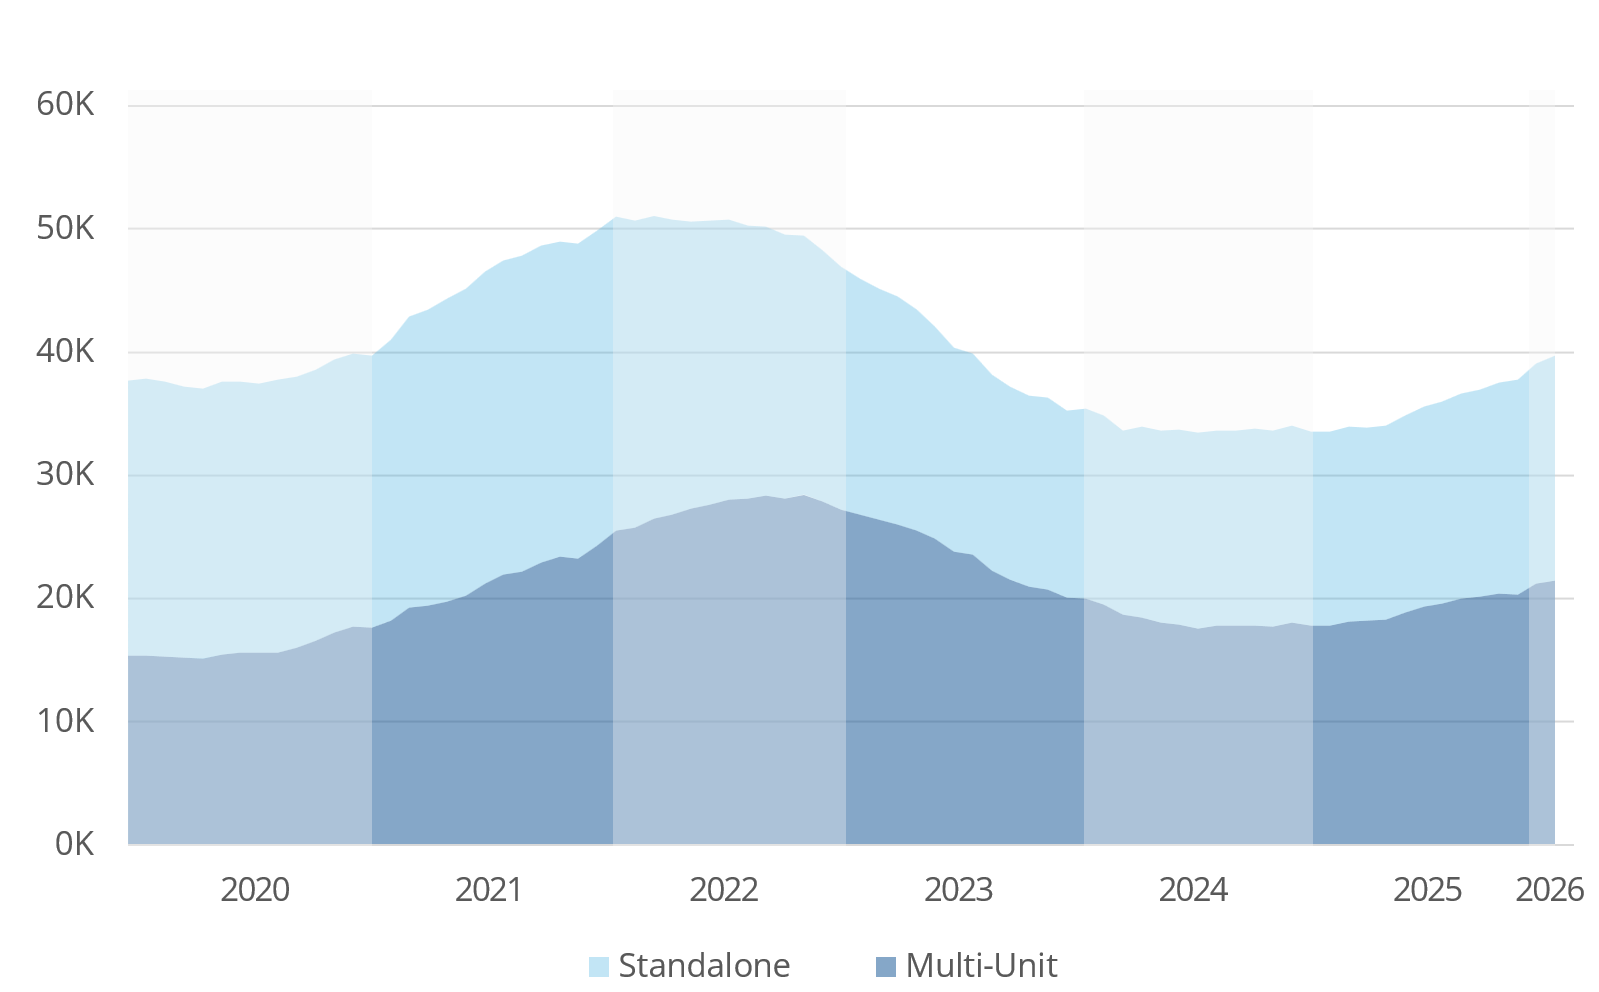
Figure 7: Composition of New Homes Consented – Annualised (Statistics NZ)
Valocity values
On the horizon
- Unemployment Rate – 5th August 2026
- Monetary Policy Statement – 2nd September 2026
- Gross Domestic Product – 17th September 2026
- General Election – 7th November 2026
For further information, or if you would like to understand more about New Zealand housing market insights please contact [email protected].