Brought to you by Senior Research Analyst Wayne Shum
Market momentum: October’s snapshot of the NZ property market
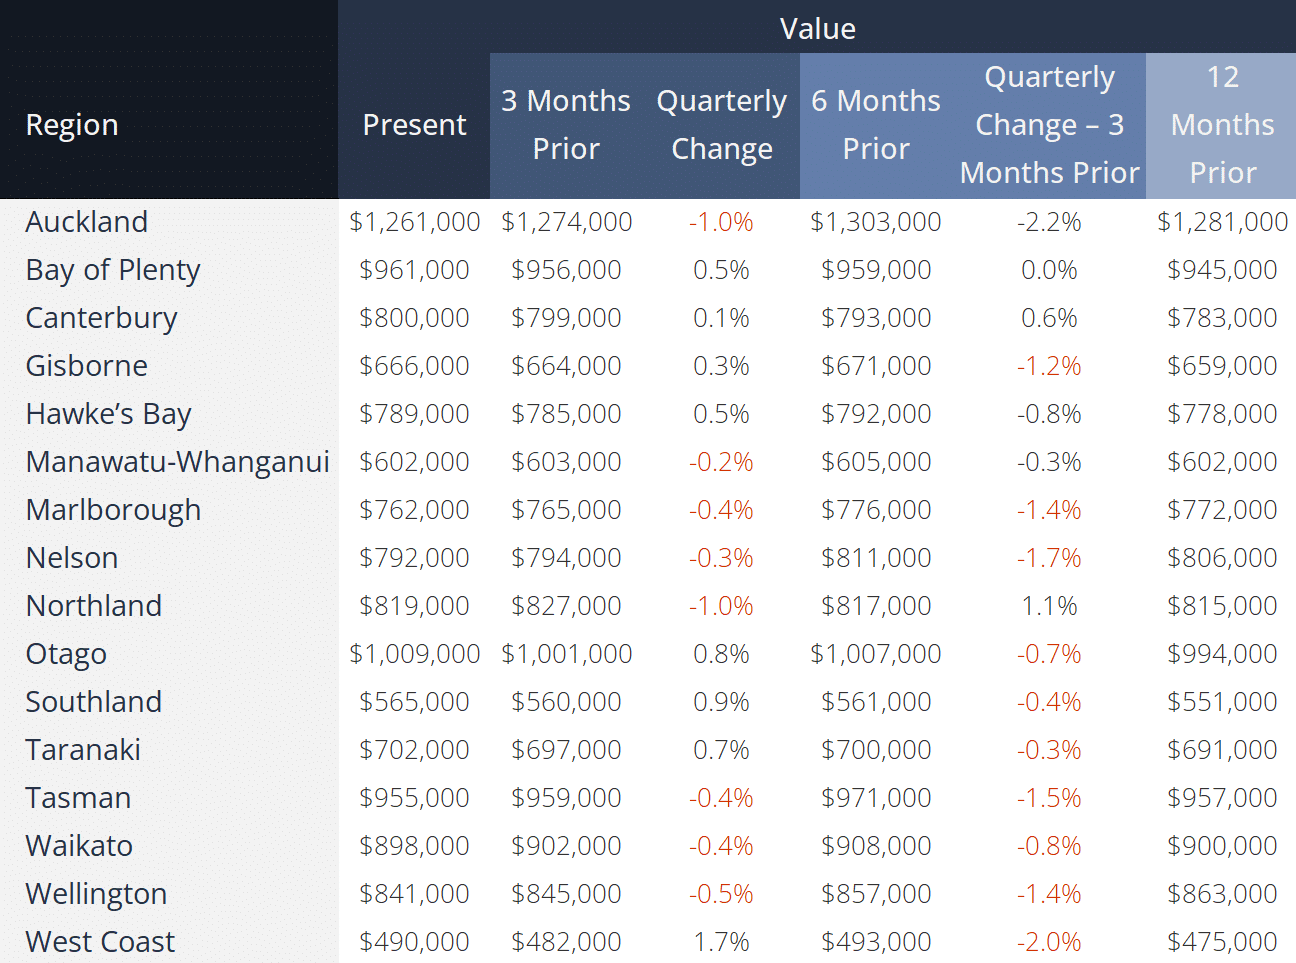
The national Valocity Value Index fell 0.4% over the past quarter, holding steady from the end of September at $957,000 and sitting 1% lower year-to-date. Early signs of recovery are emerging, with 10 of the 16 regions recording monthly gains and eight seeing quarterly increases.
The property market entered spring on a brighter note, supported by a 0.5% cut to the Official Cash Rate, with further reductions expected in November. A relaxation of Loan-to-Value ratio limits, effective 1 December, is also poised to boost buyer activity.
However, the Reserve Bank’s decision to maintain existing Debt-to-Income restrictions suggests that, while lower mortgage rates may spur transactions, they are unlikely to drive the rapid value growth seen in 2020 and 2021.
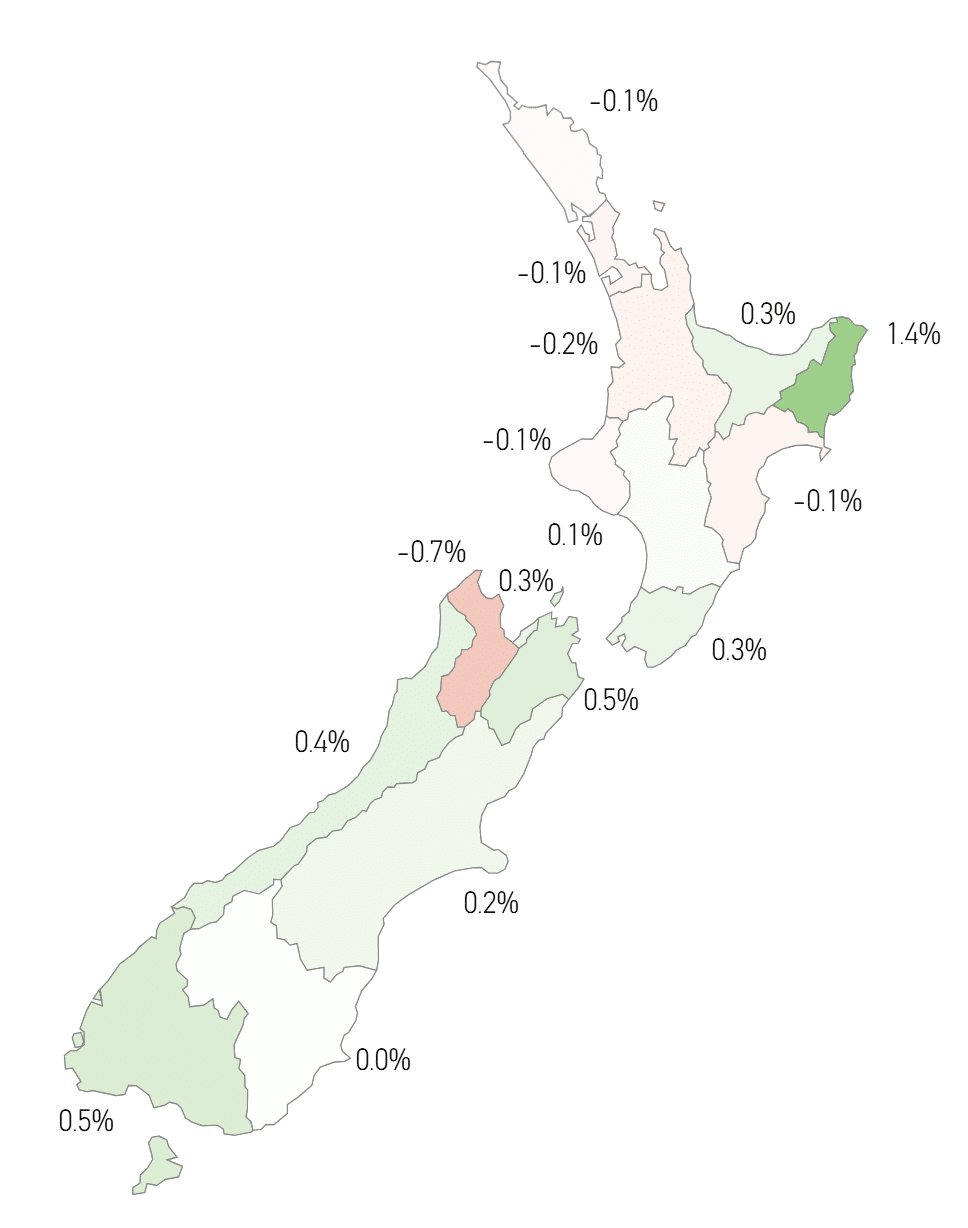
Figure 1: Valocity Value Index Movement by Region
Other economic factors continued to weigh on the property market. The latest Consumer Price Index for the year to June 2025 rose 3% – the highest in 15 months – driven by increases in electricity, rates, rent, and food costs. Despite this, inflation is not expected to prevent the Reserve Bank from implementing another OCR cut next month.
The labour market remained subdued, with unemployment rising to 5.2% – the highest level since September 2020 during the peak of the COVID-19 era. Encouragingly, early signs of recovery are emerging, as job listings have shown year-on-year growth in recent months. It may, however, take time for these improvements to translate into a tangible impact on the housing market.
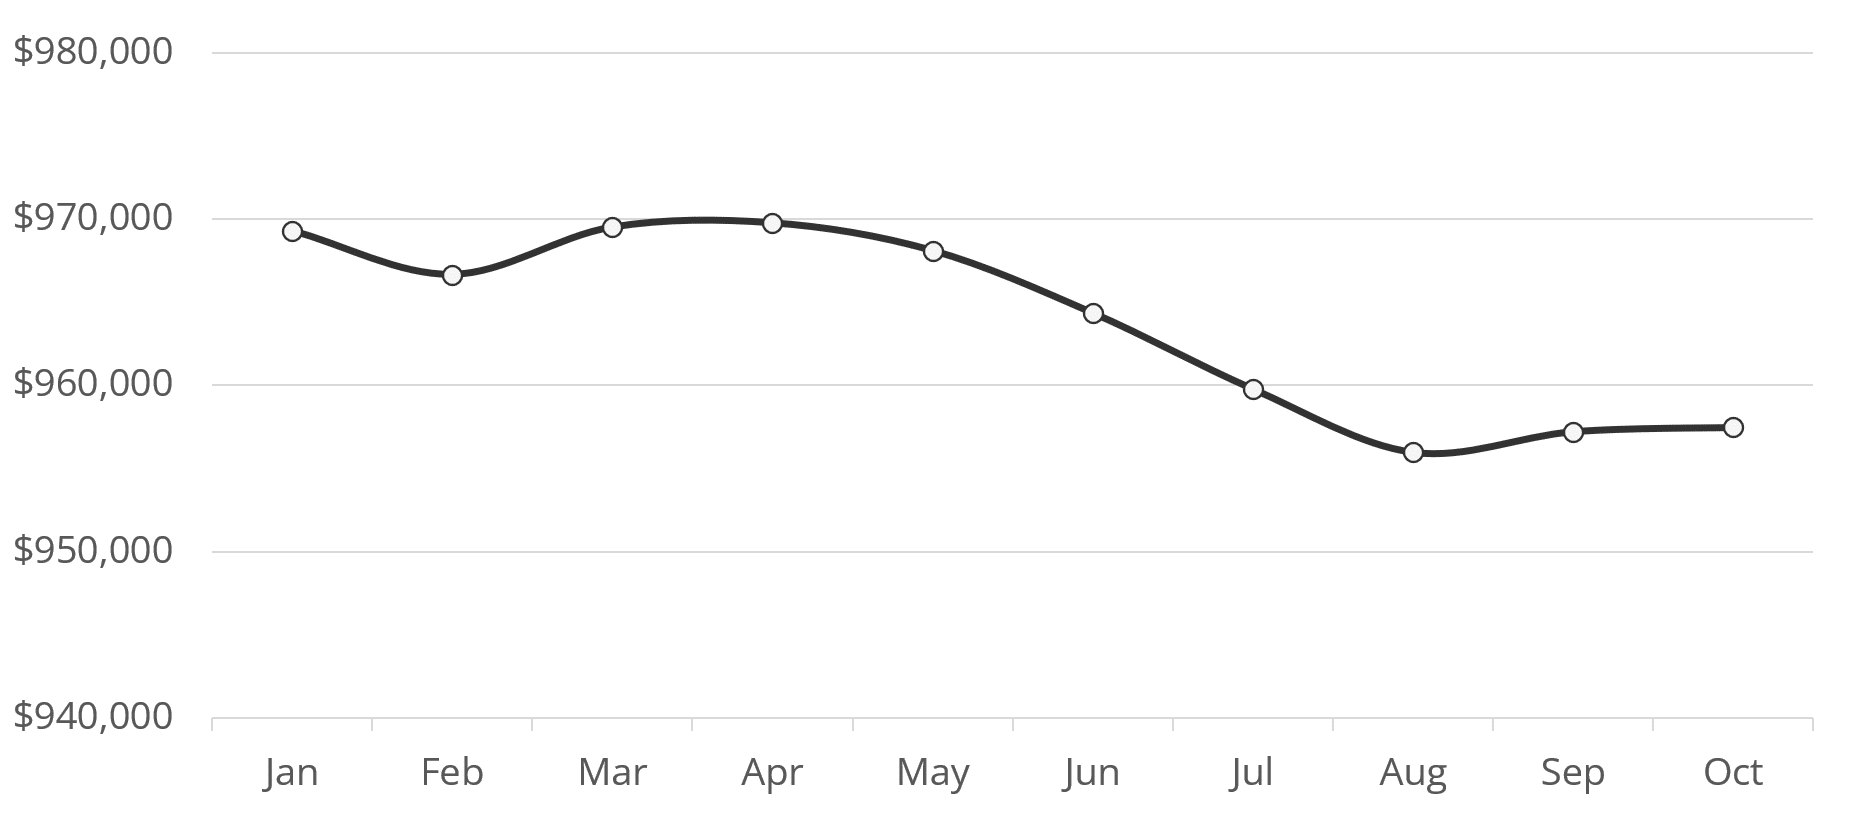
Figure 2: Valocity Value – New Zealand – 2025
The Official Cash Rate (OCR) forecast continues to trend lower, with market eyes on the November Monetary Policy Statement. The central question is whether the RBNZ will deliver a 0.25% cut as the summer break approaches. The next review – the first under the new Governor – is scheduled for February.
Mortgage rates fell further in October, with the one-year fixed rate hitting 4.45% by month-end, improving debt serviceability. However, the effects of last year’s rate cuts are still working their way through the market, and many existing borrowers may explore new opportunities as their current borrowing costs decrease.
On the policy front, the Labour Party has signalled that, if re-elected in 2026, it would introduce a Targeted Capital Gains Tax. The proposed 28% levy would apply to profits from the sale of commercial or residential properties – excluding the family home – from 1 July 2027, with revenue earmarked for funding free doctors’ visits. The measure is expected to temper house price growth. While property flippers are already covered under the existing two-year Bright-Line test, this new policy would primarily affect long-term investors, likely dampening short-term demand.
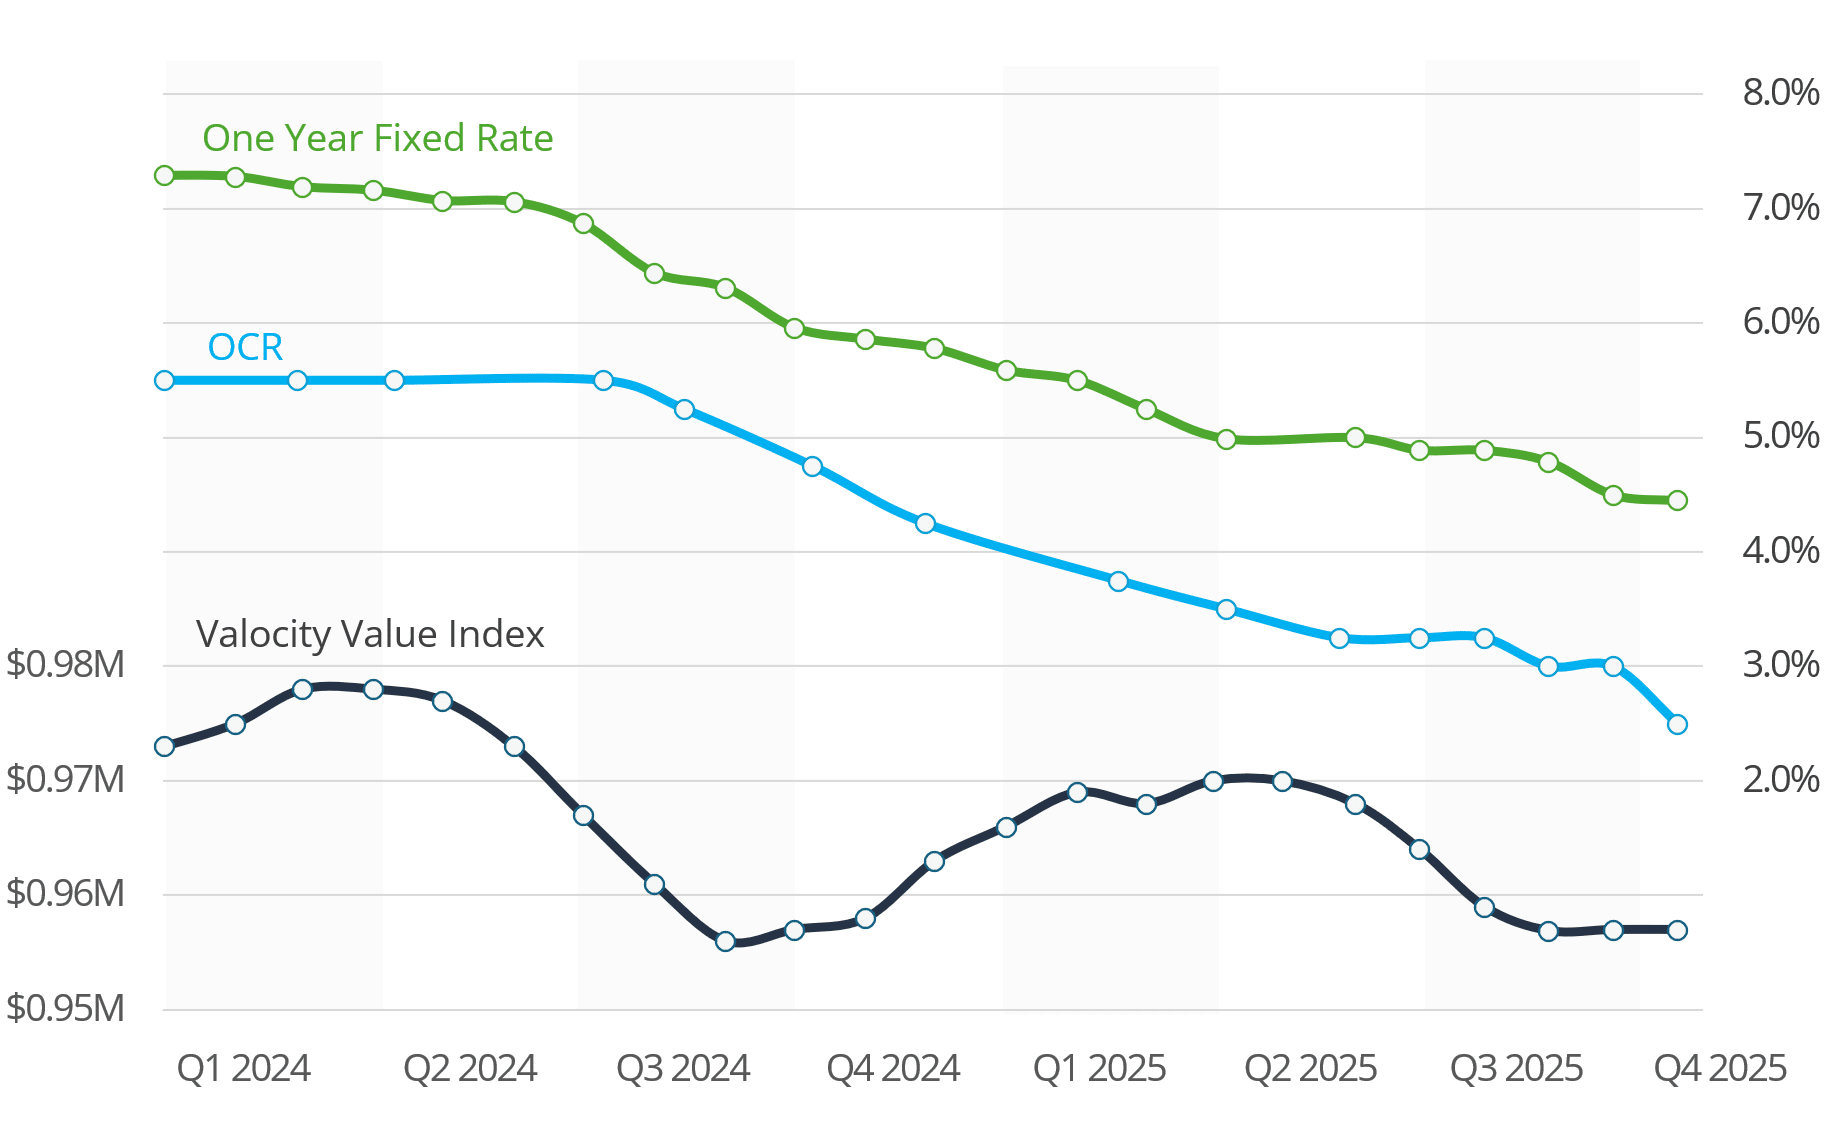
Figure 3: Valocity Value Index and Benchmark Rates
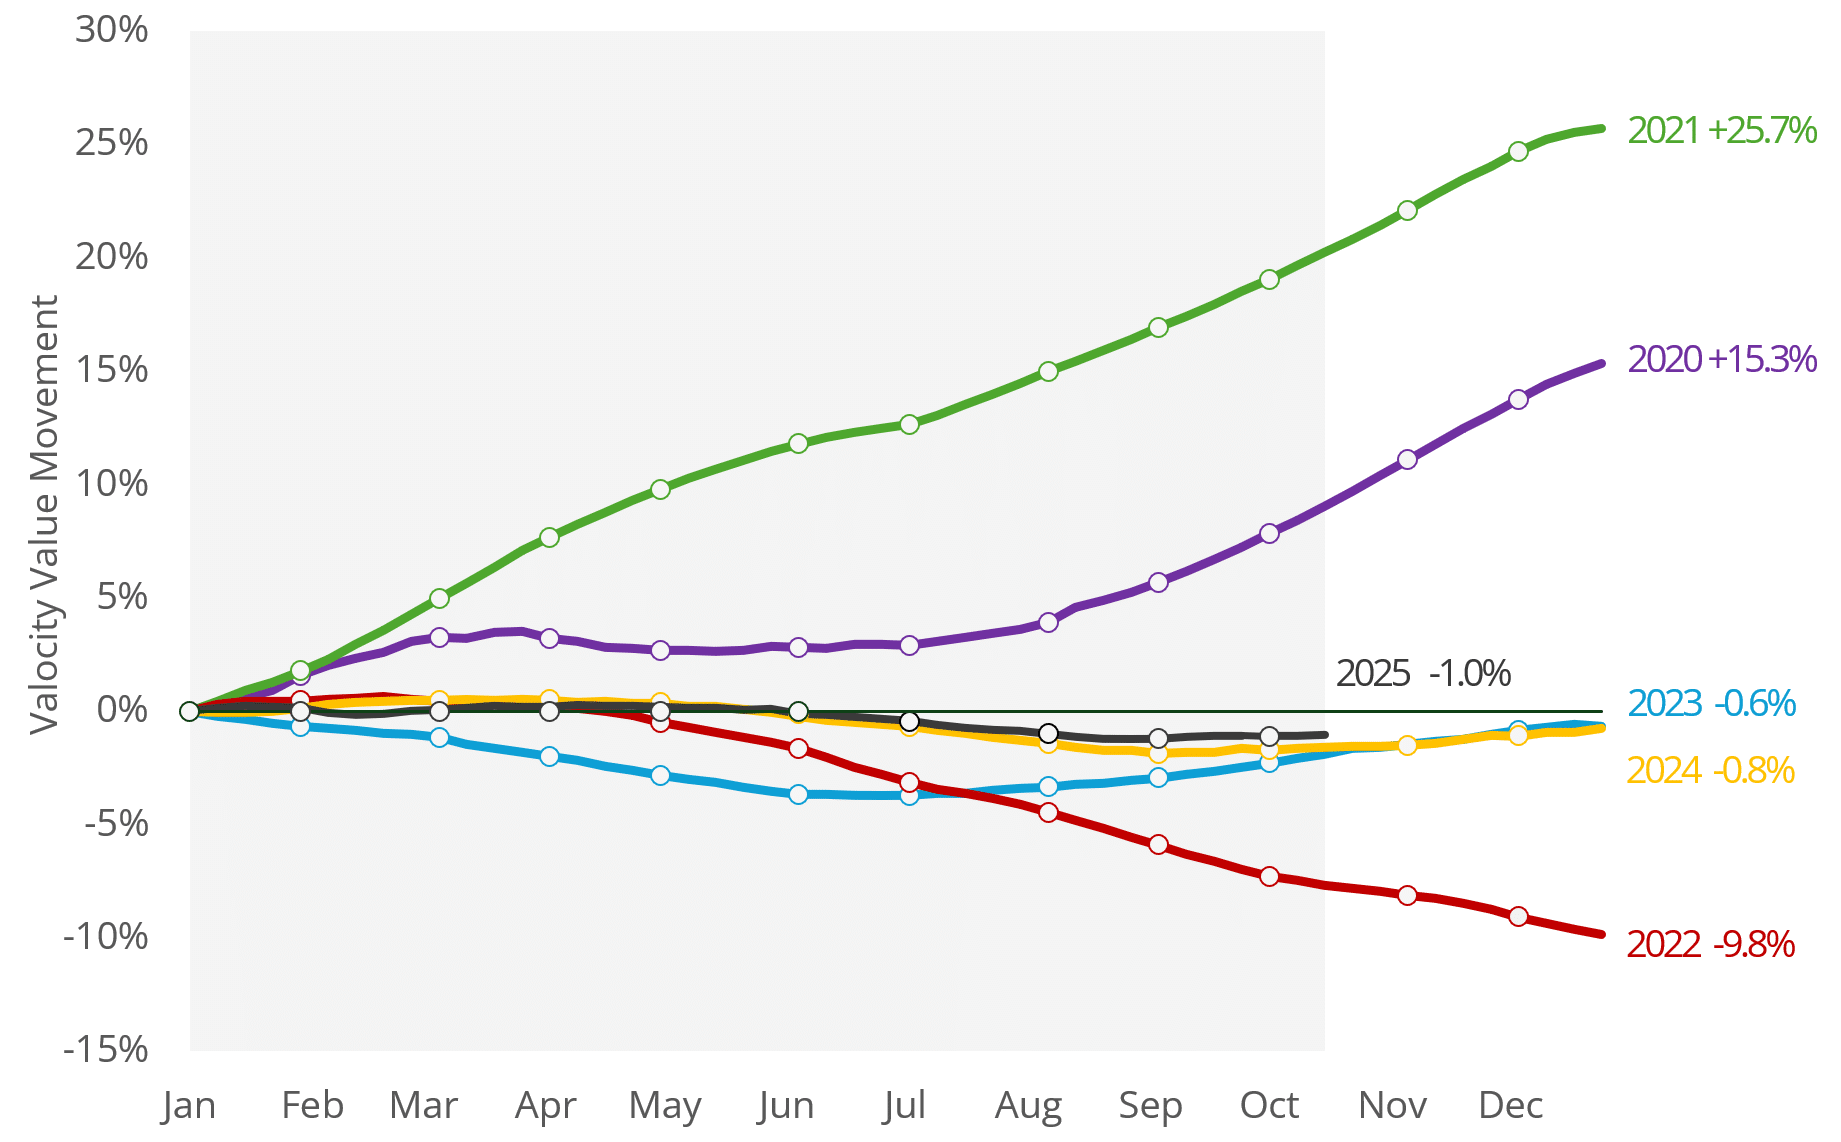
Figure 4: Valocity Value Movement – Year on Year Comparison
The national median sale price slipped to $750,000, highlighting a shift in market activity toward lower-priced properties compared with the peak levels of 2021 and 2022. This trend reflects growing buyer caution and a reluctance to take on larger mortgages – a marked contrast to the stronger borrowing appetite seen during the low-interest rate environment of 2021.
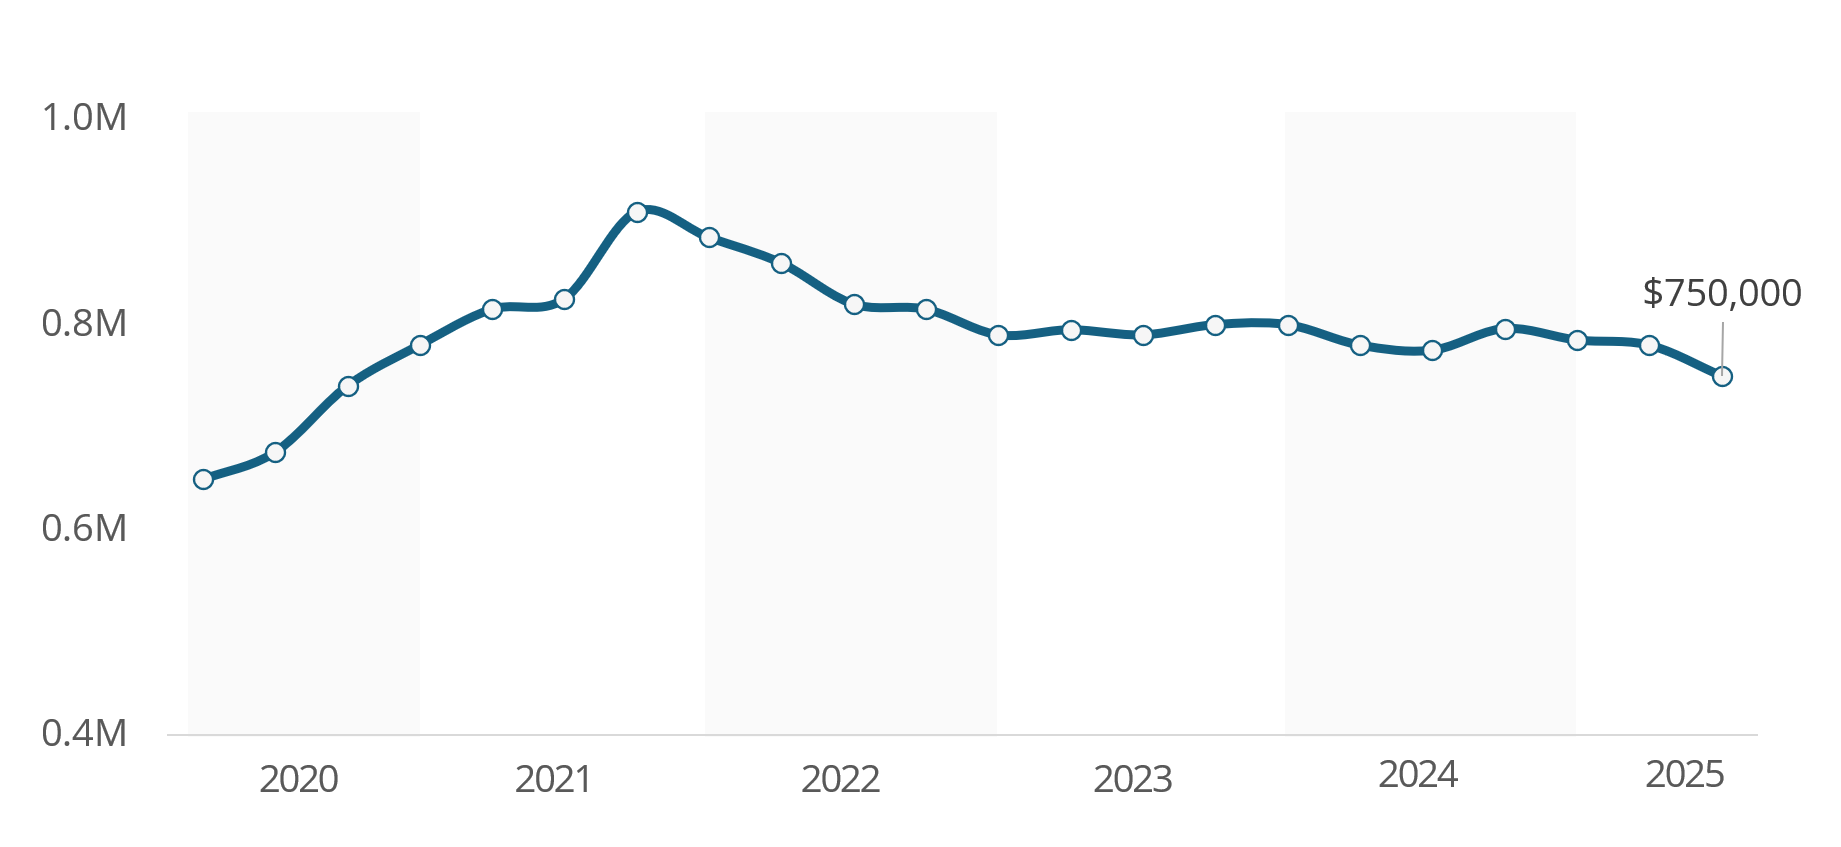
Figure 5: Median Sales Price (Settled Sales Only)
Migrant departures remained high while arrivals stayed subdued, leading to a modest net migration gain of just 10,600 in the 12 months to August 2025. This is placing pressure on the rental market, with rents largely stagnant and some landlords reporting longer vacancy periods. During the same period, nearly 74,000 New Zealanders left the country – up 10% from the previous 12 months.
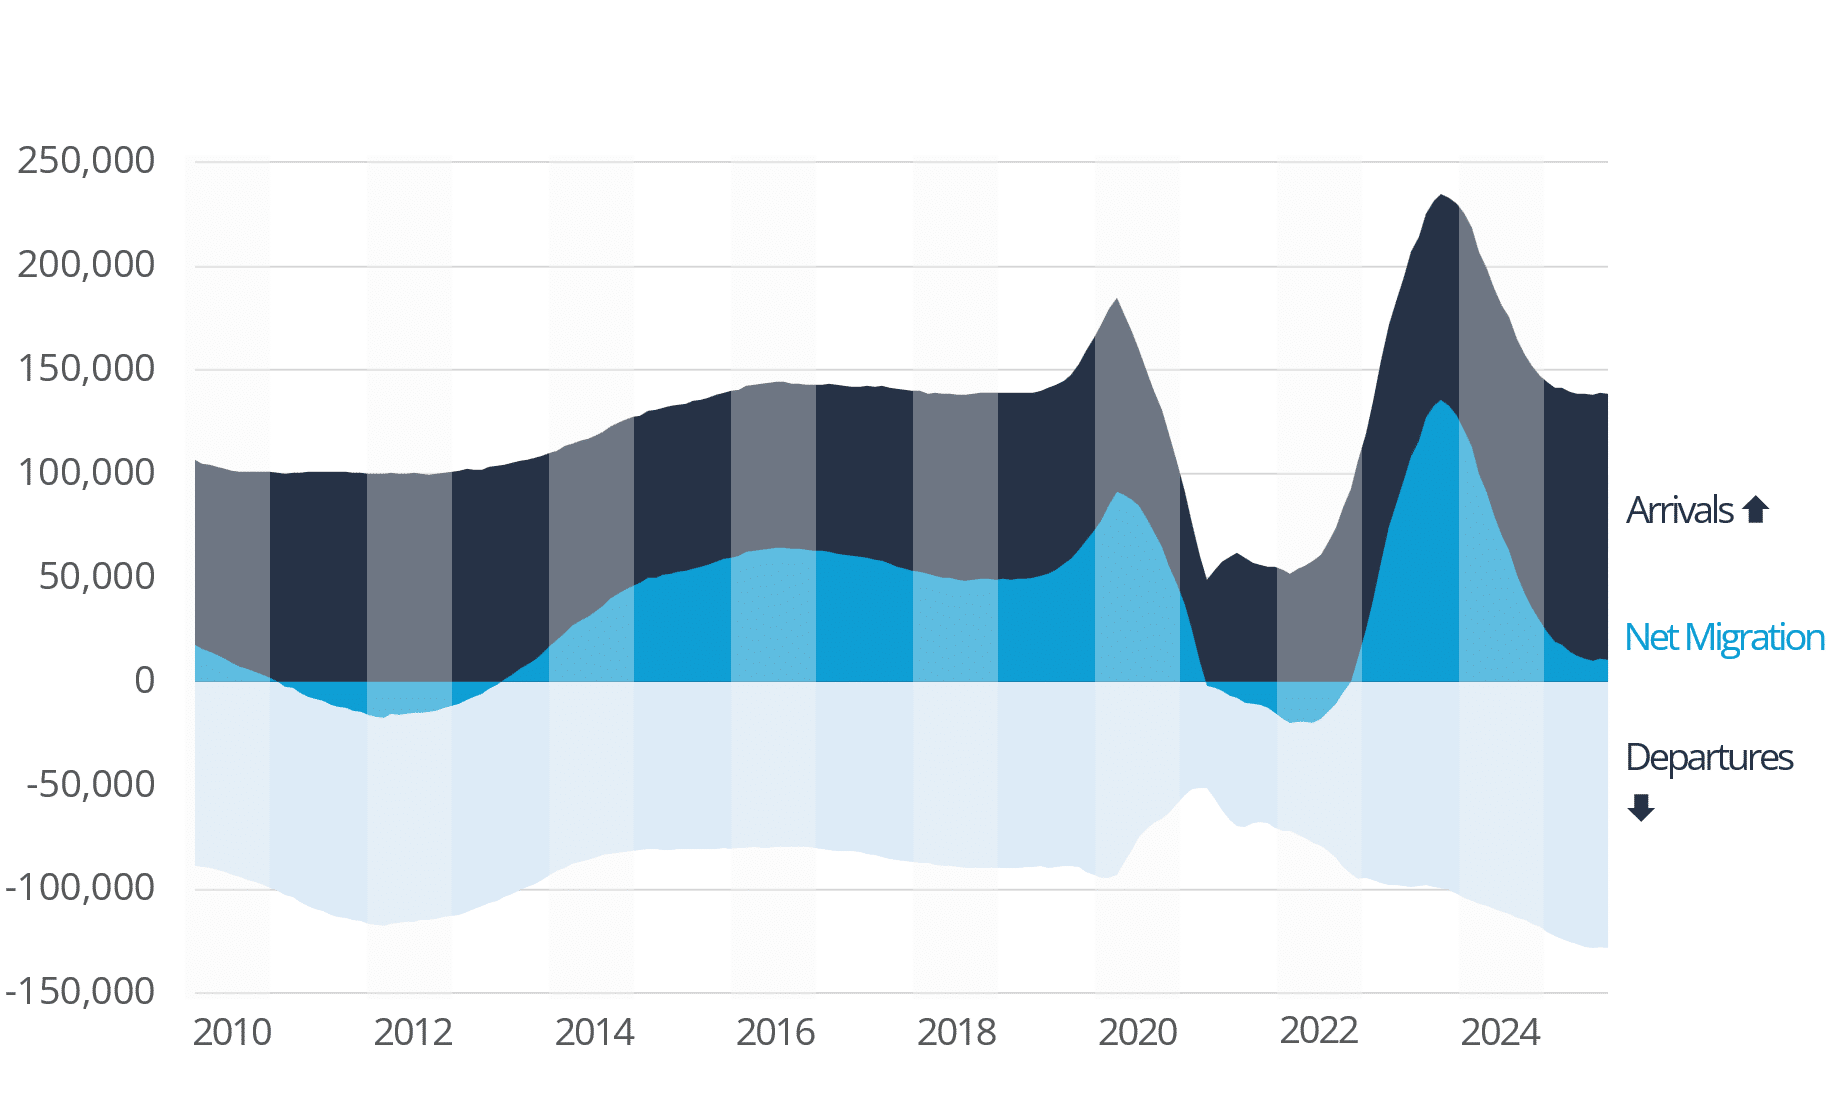
Figure 6: Annualised Net migration (Statistics NZ)
Construction
A total of 34,000 new homes were consented in the 12 months to August 2025, up 1.3% compared with the previous year. Breaking this down, stand-alone home consents rose 1%, townhouse consents declined 0.7%, and retirement village units fell sharply by 22%. Apartment consents, by contrast, surged 46% over the same period.
In Auckland, Plan Change 78, introduced in 2022 and known for its “Medium Density Residential Standards” known to some as the “three storeys everywhere” approach, was withdrawn in October. It has been replaced with Draft Plan Change 120, which reflects updated hazard assessments and emphasises walkable catchments near transport hubs and town centres. The new plan also allows increased building heights in these key locations, permitting structures of up to 15 storeys.
At the national level, the Building and Construction (Small Standalone Dwellings) Bill – commonly referred to as the Granny Flat Exemptions – was passed in October and will take effect in early 2026. The legislation permits the construction of secondary dwellings up to 70 square metres without a building consent, provided they comply with the building code, follow a simple design, and are built by professional builders. Local councils must still be notified before and after construction. The government anticipates around 13,000 granny flats will be built nationwide over the next decade.
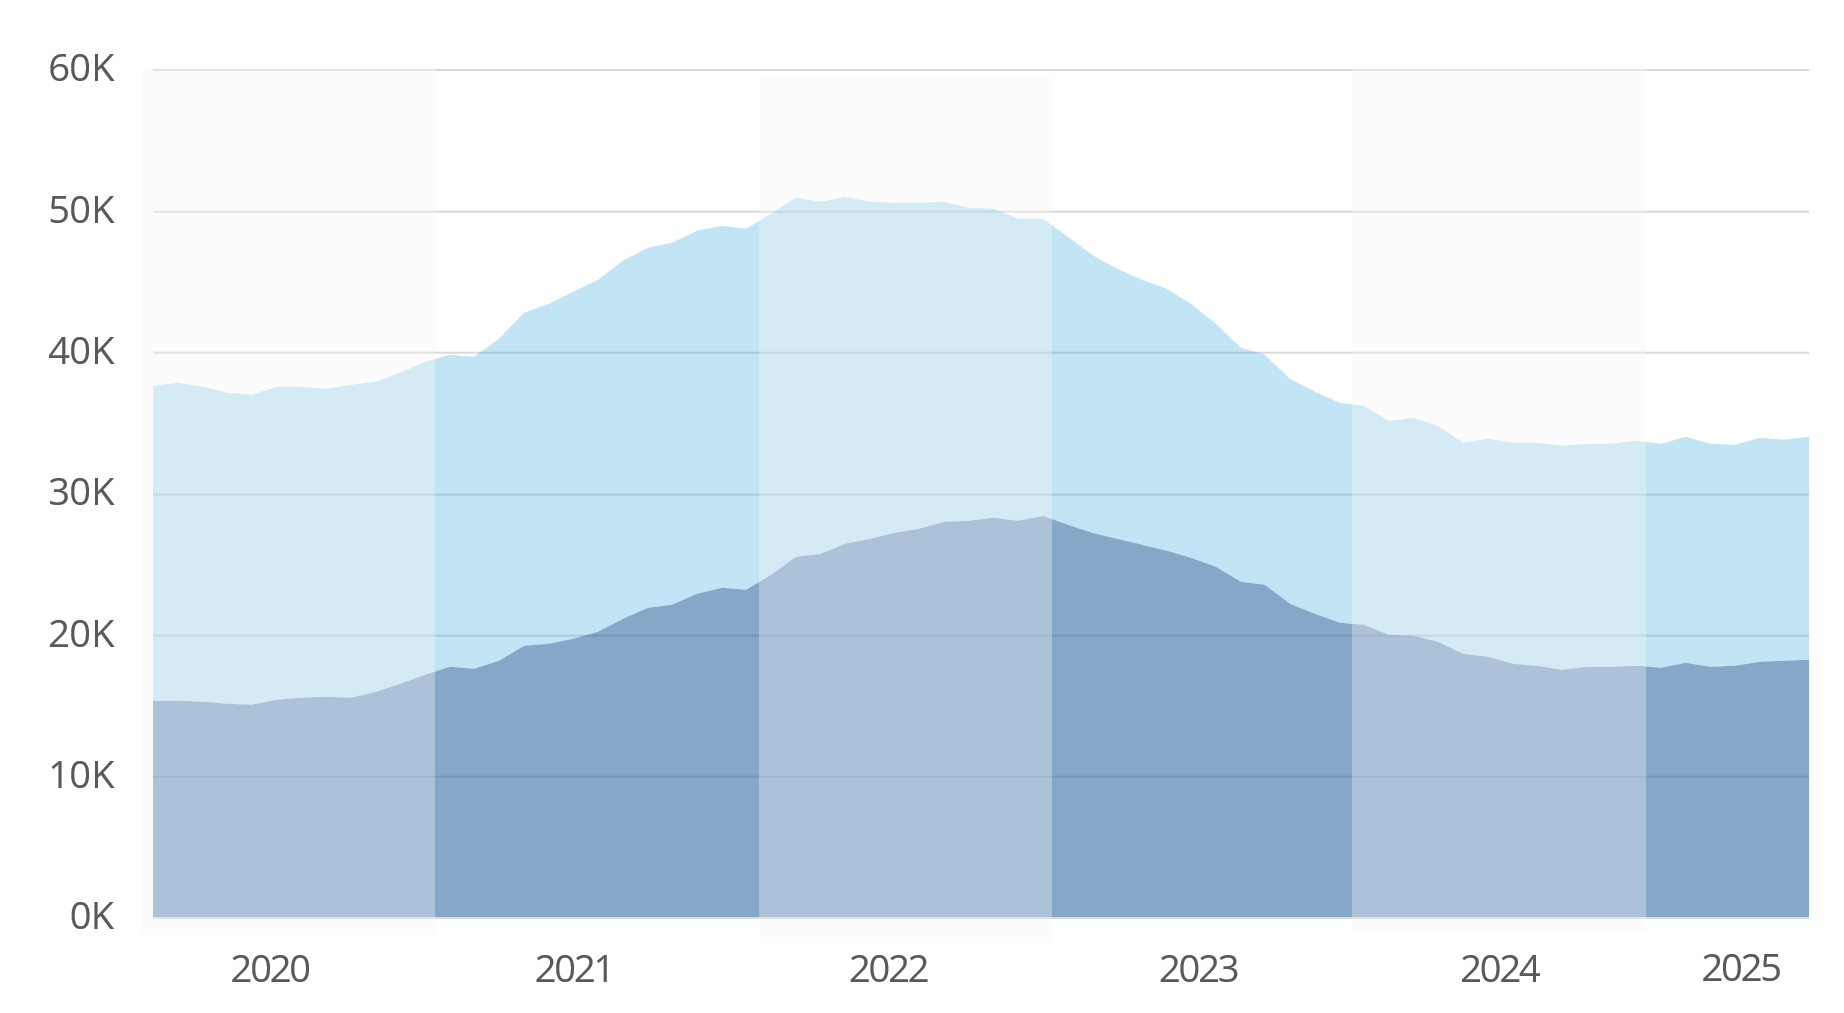
Figure 7: Composition of New Homes Consented – Annualised (Statistics NZ)
Valocity values
On the horizon
- Release of Unemployment Rate statistics by Stats NZ– 5th November
- Monetary Policy Statement and OCR – RBNZ – 26th November
- Release of Gross Domestic Product figures by Stats NZ – 18th December
For further information, or if you would like to understand more about New Zealand housing market insights please contact [email protected].

