Brought to you by the Valocity Research Team: Wayne Shum and James Wilson
Executive Summary
The New Zealand residential market has been buoyant since 2020 with a lack of housing supply one of the key drivers supporting such strong price growth.
The Government made their Housing Policy Announcement in March 2021, as of part the policy changes, the government treats new builds differently to existing homes;
- 5 year Brightline test for new builds as rental properties, 10 years for existing homes as rental properties
- Removal of Interest Deductibility for investors applies from October 2021 for existing homes. Rules for new builds are being consulted and finalised in Q3 2021
- Higher price cap for new homes than existing homes under the Kainga Ora First Home Loan and First Home Grant policies to enable and assist First Home Buyers
The aim of the policies announced in March was to boost new residential developments and tilt the balance to First Home Buyers.
As the result of the differentiation between existing homes and new builds. It has been widely reported First Home Buyers were facing off against Investors to purchase these new builds, as investors seeks to minimise their tax liabilities.
What are new homes?
For interest deductibility, the definition of new build is still being consulted by the IRD. In the proposed definition, the property must be self-contained with its kitchen and bathroom, and the dwelling having received a code compliance certificate. It is not yet known how old the property would need to be at the time of purchase to be considered as a new build. It is also unknown how long the interest deductibility would apply for.
Kainga Ora identified new builds as those that have a Code Compliance Certificate with the past 12 months.
For our analysis, Valocity considered a property a ‘new build’ if the home appeared on the district valuation roll since 2020, meaning that at most the property would be less than two years old.
So, who is buying new builds?
Mortgage registration data was analysed to determine the buyer composition of new homes. Of the five buyer groups, First Home Buyers had the largest share each month for the past 18 months, followed by Investors, Movers and Multi-homeowners. Valocity defines the buyer classification as follows:
| First Home Buyer | Identifies situations where the buyer has never previously owned a property – it is their first home |
| Movers | When a homeowner sells one property, to buys a new property |
| Multi-home Owner | The buyer already owns another property, so they are multi-homeowners. This takes into account minor investors or a family owning a home and a bach |
| Investor | Where the owner owns three or more properties, takes into account commercial owners with multiple investment properties as well as individual owners who own a home as well as several rentals |
| Re-entering the Market | If the buyer has previously owned a property, but has not done so for at least a year |
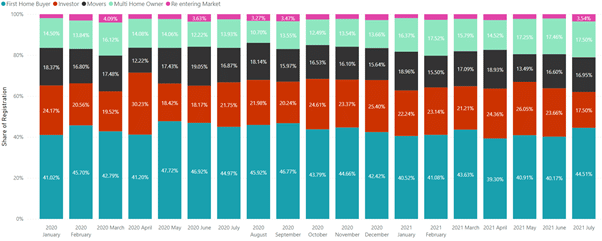
Graph 1: Buyer Composition – New Zealand
After the national lockdown in April 2020, the RBNZ suspended LVR requirement and lowered the OCR. This unlocked the equity existing homeowners have built up, and lowered repayments, enabling them to purchase additional properties. Since this time, we can see investors and Multi Homeowners’ share of new build mortgage registrations have increased at the expense of First Home Buyers.
In Auckland, whilst Investors and Multi homeowners’ share of the new homes market had increased in the latter half of 2020 and first half of 2021. The rental returns offered in Auckland is lower than the regions and therefore investors’ shares of new build purchases outside of Auckland grew.
")
aph 2: Buyer Composition – Auckland
First Home Buyers’ share of the new homes market appears to be bouncing back from July 2021, but it is too early to establish the cause of this recovery.
What are they buying?
All buyer groups preferred new standalone dwellings.
First Home Buyers accounted for 42.6% of all new homes purchased, followed by Investors.
First Home Buyers had the highest share of new townhouses in their buying mix, this was driven by the Auckland market where the Unitary Plan encourages townhouse developments. Townhouses also generally offer lower priced, entry level options in most markets. Whilst affordability is the key driver to buying decision in the main centres, interestingly first home buyers stayed away from apartments where the lending rules were generally different or required higher deposit levels.
Multi Homeowners, who were purchasing their first investment property, exhibited similar buyer behaviour to first home buyers, favouring standalone dwellings, units, and townhouses over apartments.
Investors who own three or more properties are more likely to diversify into apartments and townhouses.
| Apartments | Dwellings | Flats / Townhouses | Share of total | |
| First Home Buyer | 4.2% | 28.4% | 10.0% | 42.6% |
| Investor | 5.4% | 13.9% | 5.0% | 24.2% |
| Mover | 0.4% | 13.3% | 1.5% | 15.2% |
| Multi Homeowner | 1.7% | 11.2% | 2.5% | 15.4% |
| Re Entry to Market | 0.3% | 1.8% | 0.5% | 2.6% |
Table 2: Market Composition – New Zealand
As expected, First Home Buyers were generally purchasing smaller homes than Investors and Multi Homeowners. The trend is more evident for apartment buyers where it is smaller by 42% and 14% smaller dwelling.
| Apartments | Dwellings | Flats / Townhouses | |
| First Home Buyer | 66 | 170 | 108 |
| Investor | 94 | 194 | 114 |
| Mover | 83 | 205 | 135 |
| Multi Homeowner | 95 | 198 | 115 |
| Re Entry to Market | 76 | 182 | 108 |
Table 3: Average Property Area (sqm)
How much are they paying?
Not unexpectedly, First Home Buyers getting onto the property ladder paid the less for their first home of all buyer groups. Interestingly, those who exited and re enter the market were purchasing similar properties to First Home Buyers.
Movers who were generally seeking larger homes to cater to growing families paid the most.
| Apartments | Dwellings | Flats / Townhouses | |
| First Home Buyer | $649,000 | $730,000 | $670,000 |
| Investor | $729,000 | $785,000 | $680,000 |
| Mover | $800,000 | $879,750 | $845,000 |
| Multi Homeowner | $715,000 | $827,000 | $720,000 |
| Re Entry to Market | $670,000 | $730,000 | $722,913 |
Table 4 – Median Purchase Price
Conclusion
Analysis of mortgage data reveals Investors’ share of first home purchases increased the most since the latter half of 2020 at the expense of First Home Buyers. This was largely driven by the increased equity, and lower LVR requirement in the same period. Existing homeowners were able to unlock the equity in their homes to purchase additional properties.
Across New Zealand including Auckland, Investors and Multi-home buyers’ share has declined in July 2021. Potentially the policy changes in March are having the desired impact, to tilt the balance away from Investors and towards First Home Buyers, however it is important to note that it is still early days. Further exasperating this is the fact that new homes are generally marketed off plans during design phase or construction periods causing the settlement to be delayed until when the new home is complete and title issued, in the current market this could be up to 18 months away. The impact of the March 2021 policy shift is yet to be known for some time yet.
In the meantime, First Home Buyers are eager to enter the market and Investors are reassessing their position as mortgage rates started to rise. The tilt to First Home Buyers in July 2021 maybe the beginning of a new trend or a temporary balancing. The balance may swing in the near future once the new build consultation is completed by the IRD.
For further information or if you would like to understand more about new build purchases please contact wayne.shum@valocityglobal.com or james.wilson@valocity.co.nz
Appendix:
| First Home Buyer | Investor | Movers | Multi Home Owner | Re entering Market | |
| Jan-20 | 41% | 24% | 18% | 15% | 2% |
| Feb-20 | 46% | 21% | 17% | 14% | 3% |
| Mar-20 | 43% | 20% | 17% | 16% | 4% |
| Apr-20 | 41% | 30% | 12% | 14% | 2% |
| May-20 | 48% | 18% | 17% | 14% | 2% |
| Jun-20 | 47% | 18% | 19% | 12% | 4% |
| Jul-20 | 45% | 22% | 17% | 14% | 2% |
| Aug-20 | 46% | 22% | 18% | 11% | 3% |
| Sep-20 | 47% | 20% | 16% | 14% | 3% |
| Oct-20 | 44% | 25% | 17% | 12% | 3% |
| Nov-20 | 45% | 23% | 16% | 14% | 2% |
| Dec-20 | 42% | 25% | 16% | 14% | 3% |
| Jan-21 | 41% | 22% | 19% | 16% | 2% |
| Feb-21 | 41% | 23% | 15% | 18% | 3% |
| Mar-21 | 44% | 21% | 17% | 16% | 2% |
| Apr-21 | 39% | 24% | 19% | 15% | 3% |
| May-21 | 41% | 26% | 13% | 17% | 2% |
| Jun-21 | 40% | 24% | 17% | 17% | 2% |
| Jul-21 | 45% | 18% | 17% | 18% | 4% |
Table 1: Buyer Composition – New Zealand